Published on: 2025-05-26
Updated on: 2026-08-20
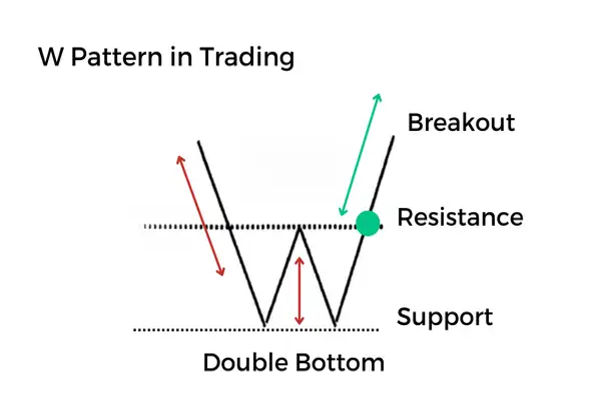
The W pattern is a bullish reversal chart pattern that forms when price falls to a low, rebounds, drops to a similar low, and then rises again. The two lows and the peak between them trace the shape of the letter W. Technical analysts also call it the double bottom. The pattern shows that sellers failed twice to push price lower, and it completes only when price closes above the peak between the two lows, a level known as the neckline.
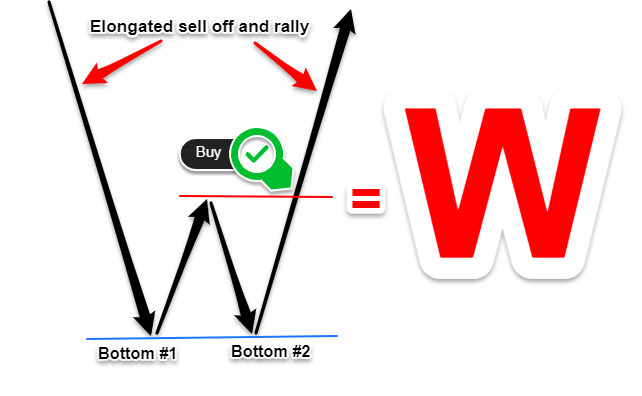
The W pattern and the double bottom are the same formation: two lows near one price with a peak between them.
Confirmation requires a candle close above the neckline. An intraday wick above it does not count.
In Thomas Bulkowski’s US stock studies, about 5% of confirmed double bottoms fail to rise at least 5%.
The measured move target equals the pattern height added to the breakout level.
A W pattern appears after a downtrend. The first low forms when selling pressure pauses and early buyers step in. The rebound stalls, and price falls again. The second low is the decisive moment: sellers try to break the previous low and fail, trapping late short sellers and showing that demand absorbs supply at that level. When price then breaks the neckline, trapped shorts buy to cover and new buyers enter, which fuels the move higher.
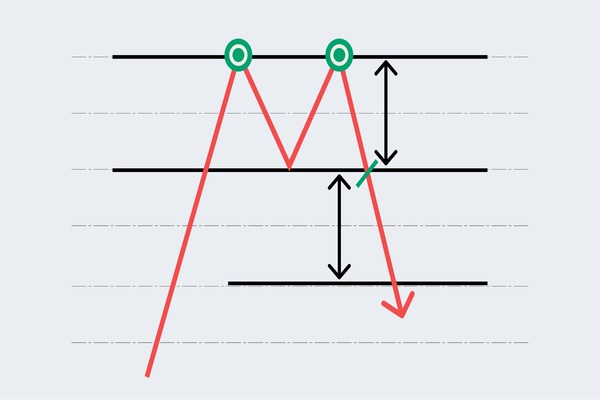
The W pattern is the mirror image of the double top, or M pattern, which signals a bearish reversal after an uptrend. Both belong to the family of classical reversal formations covered in our guide to the most common chart patterns.
Five conditions separate a valid W pattern from random price movement.
A prior downtrend is in place. Without a decline, there is nothing to reverse.
The two lows form at a similar price. In Bulkowski’s data, they typically sit within 6% of each other, and on daily charts they usually appear two to seven weeks apart.
A clear rebound separates the lows. The middle peak often stands about 10% above the first low. A shallow bounce produces a weak neckline.
Volume falls into the second low. Lighter selling on the second test shows sellers are losing conviction. Volume should then expand on the breakout.
A candle closes above the neckline. The pattern is complete only at that close. Acting before confirmation is the most common mistake with this formation.
A confirmed breakout often turns the neckline into support, a behaviour covered in our guide to support and resistance levels.
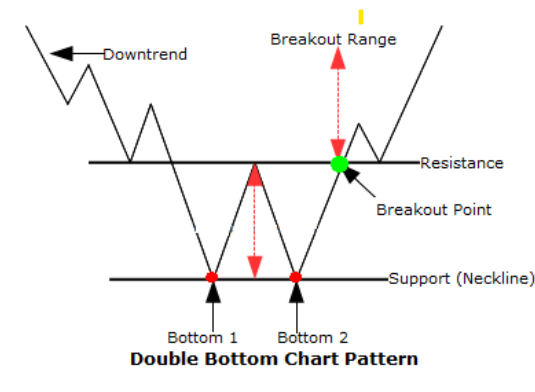
The second low rarely matches the first exactly. Three variations are common.
Equal lows: the textbook version, with both lows near the same price.
A higher second low: buyers stepped in before price reached the first low. Many traders read this as a sign of stronger demand.
A lower second low: price briefly breaks the first low, triggers stop-loss orders, then reverses. Bulkowski calls this an ugly double bottom. It looks like failure but often precedes a strong recovery.
The most detailed public statistics come from Thomas Bulkowski, whose Encyclopedia of Chart Patterns (3rd edition, Wiley, 2021) and ongoing studies measure thousands of double bottoms in daily US stock data.
About 5% of confirmed double bottoms fail to rise at least 5% after the breakout. Waiting for the neckline close is what keeps that failure rate low.
The average rise to the eventual peak ranges from roughly 35% to 41% depending on the variation, measured across thousands of US stock patterns between 1991 and 2025.
Price returns to retest the neckline, a move called a throwback, about 65% of the time.
Treat these numbers with care. They average many positions held to the eventual peak and do not describe a typical single trade in forex or gold. Some websites quote an 88% success rate for the pattern; that figure is a third-party summary, not Bulkowski’s own metric.
The classic method has three parts: entry, stop-loss, and target.
Entry: The standard trigger is a candle close above the neckline. A more patient approach waits for the throwback and treats the neckline retest as the entry area. The retest gives a better price but misses patterns that never pull back.
Stop-loss: A common placement is just below the second low. After a throwback, some traders move it below the retest low instead. The distance between entry and stop defines the position's risk.
Target: The measured move rule projects the pattern height upward: subtract the lowest low from the neckline, then add that distance to the breakout level. If a currency pair forms lows near 1.0800 and a neckline at 1.0900, the height is 100 pips and the measured target is 1.1000.
Many traders add a filter such as bullish RSI divergence at the second low, where price makes a similar low while the indicator makes a higher low. Charting tools in MetaTrader 5 can mark the neckline and measure the projection in seconds.
False breakouts: price pushes above the neckline during the session, attracts buyers, then closes back below it. This is a classic fakeout, and it's why confirmation requires a closing price rather than a spike.
Busted patterns: sometimes a confirmed breakout rises less than 10% and then reverses. In Bulkowski’s data, busted double bottoms fall about 15% on average, which turns a failed bullish signal into a bearish one.
Strong downtrends: a W pattern that forms against a steep, high-momentum decline fails more often than one that appears after selling has already slowed.
Timeframe matters as well. Daily and weekly patterns carry more weight than intraday shapes, where market noise creates many false Ws. The formation appears in forex, gold, indices, and stocks, and the same rules apply everywhere.
Several bullish reversal shapes look alike. The differences decide how each is confirmed.
Pattern |
Shape |
Key difference |
|---|---|---|
Double bottom (W) |
Two lows, one peak |
Completes on a neckline close |
Triple bottom |
Three lows near one level |
Slower to form; each extra test adds evidence |
V-bottom |
One sharp low |
No second test, so there is no neckline to confirm |
Inverse head and shoulders |
Three lows, middle one deepest |
Neckline can slope; often a deeper base |
Our separate guide to double bottom trading strategies covers entry tactics for this formation in more depth.
Bullish. It forms after a downtrend and signals a possible reversal higher. Its bearish mirror image is the M-shaped double top, which forms after an uptrend.
Yes. Both names describe the same formation: two lows near one price level with a peak between them. Trading platforms and textbooks use the terms interchangeably.
A candle close above the neckline, the peak between the two lows. Rising volume on the breakout strengthens the signal. An intraday spike above the level does not count.
Measure the vertical distance from the lowest low to the neckline, then project that same distance upward from the breakout point. Traders call this the measured move.
Thomas Bulkowski’s US stock studies show about 5% of confirmed double bottoms fail to rise at least 5%. Average gains near 35% to 41% reflect long holding periods, not typical single trades.
Daily and weekly charts produce more reliable W patterns because each candle carries more information. Intraday charts show the shape often, but market noise creates more false signals.
The W pattern earns its place in technical analysis because its rules are objective: two lows, a neckline, a confirmed close, and a measurable target. The statistics behind it are encouraging but come from one market and long holding periods. The practical next step is to test the pattern on the instruments and timeframes you trade, record the results, and let that record decide how much weight the pattern deserves in your process.
Disclaimer: This material is for general information purposes only and is not intended as (and should not be considered to be) financial, investment or other advice on which reliance should be placed. No opinion given in the material constitutes a recommendation by EBC or the author that any particular investment, security, transaction or investment strategy is suitable for any specific person.