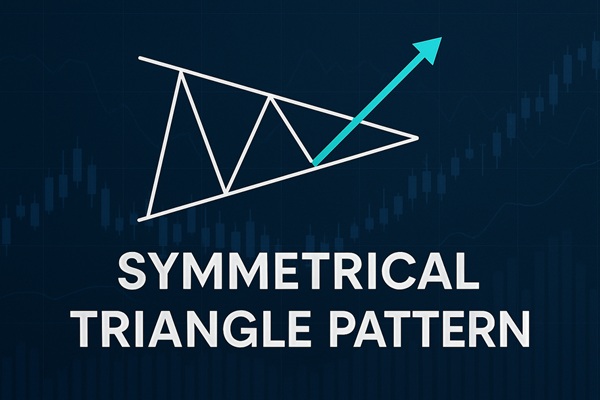
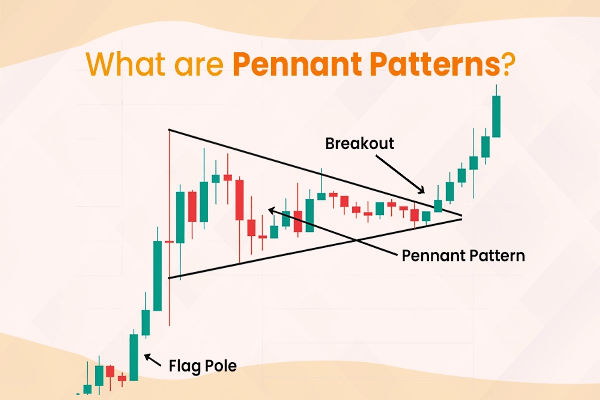
Among the many chart formations traders rely on, the symmetrical triangle pattern is one of the most widely recognised and potentially rewarding. Appearing across multiple timeframes and financial markets—from forex and equities to commodities and cryptocurrencies—this pattern represents a temporary equilibrium between buyers and sellers before a decisive move.
For traders, recognising the symmetrical triangle early and applying sound trading principles around it can lead to strong risk-reward opportunities.
Trend Confirmation Before Analysis
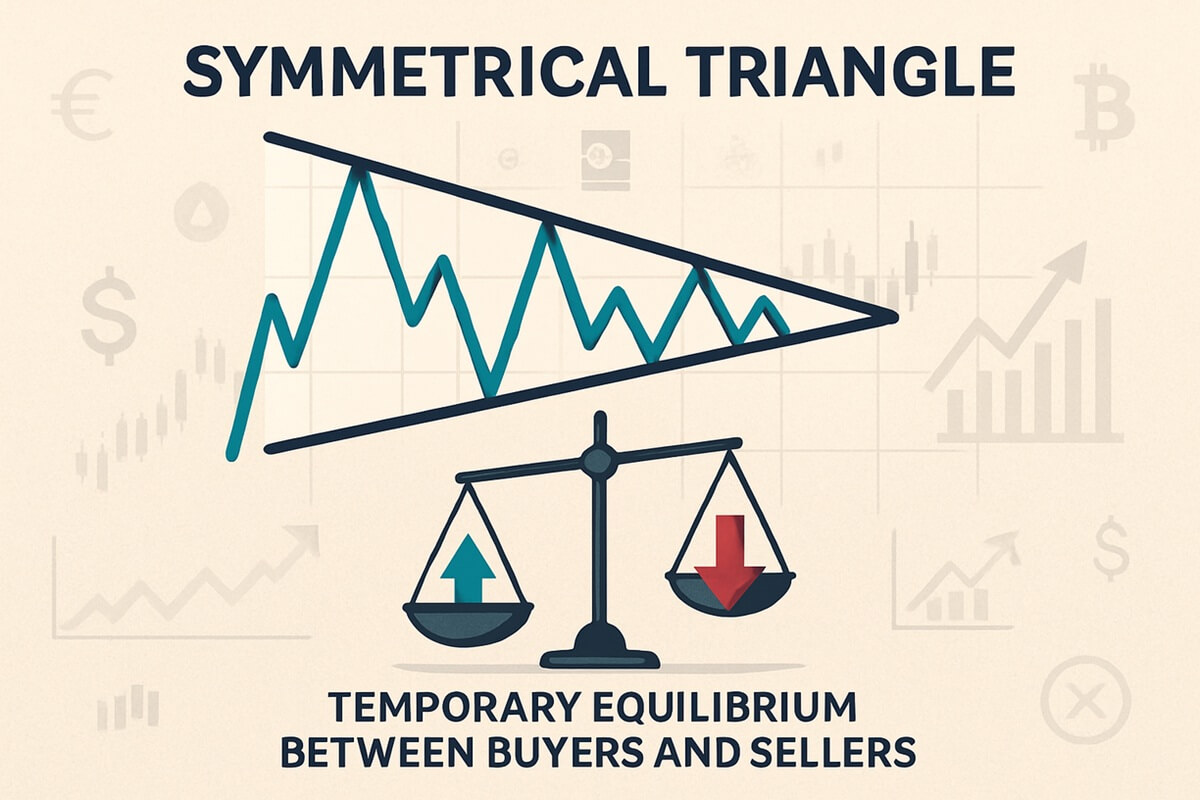 The symmetrical triangle is most effective when it forms as part of a continuation pattern—meaning it emerges in the middle of an existing trend. Whether bullish or bearish, traders should look for a clearly established trend before the pattern begins to form.
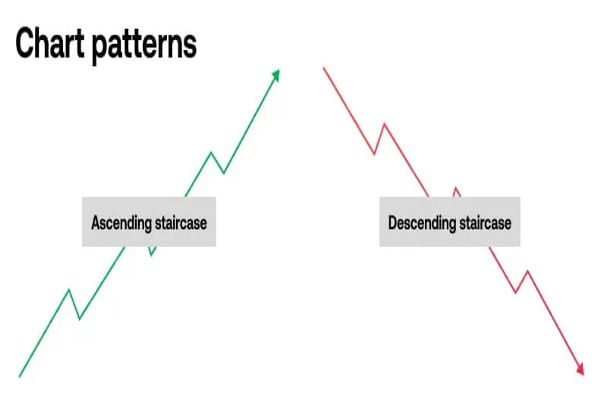
In an uptrend, the triangle usually signals a pause before prices continue higher. In a downtrend, it can signal a consolidation before the next leg down. It is not uncommon, however, for a symmetrical triangle to act as a reversal in certain market conditions—though these are statistically less reliable.
Before attempting to trade a symmetrical triangle, it's essential to ask: "Was there a clear directional move leading into this?" Without this, the pattern lacks the contextual edge required for higher-probability trading.
Entry Strategies
Entry signals for symmetrical triangles depend on one key event: the breakout. This occurs when the price moves decisively beyond one of the triangle's converging trendlines—either upward through resistance or downward through support.
There are two common approaches to entry:
Aggressive entry: Place a buy order slightly above the upper trendline (or a sell order below the lower trendline), in anticipation of a breakout. This method can capture early moves but carries higher risk of false signals.
Conservative entry: Wait for a confirmation candle to close beyond the trendline, ideally on higher volume. This offers more certainty but may sacrifice a portion of the move.
In both cases, traders often set entry orders just beyond the breakout point to avoid slippage and catch momentum-based moves.
False Breakouts & Confirmation
Symmetrical triangles are prone to false breakouts, where price briefly moves outside the pattern before snapping back inside. These can be costly if traders enter too early without additional confirmation.
To improve reliability, look for the following confirmation signals:
Volume spike: A legitimate breakout is usually accompanied by rising volume, confirming that institutional money is participating in the move.
Retest of the trendline: Often, price will break out and then retest the former triangle boundary. A successful retest followed by continuation adds conviction to the setup.
Indicator alignment: Support from indicators like RSI, MACD, or Bollinger Bands can help validate the breakout's direction.
Patience is key—waiting for multiple signals can significantly reduce the likelihood of getting trapped in a failed breakout.
Stop‑Loss Placement
Proper stop-loss placement is critical for managing risk in triangle breakouts. Traders generally consider two main approaches:
Technical stop: Place the stop just beyond the opposite side of the triangle. For example, if buying a breakout above the triangle, the stop would go just below the lower support trendline.
Volatility-based stop: Use tools like ATR (Average True Range) to set a stop that accounts for typical price fluctuations. This helps avoid being stopped out by routine noise.
It's essential not to place stops too tight within the triangle, as the price action within the pattern is naturally compressed and can easily trigger premature exits.
Setting Take‑Profit Zones
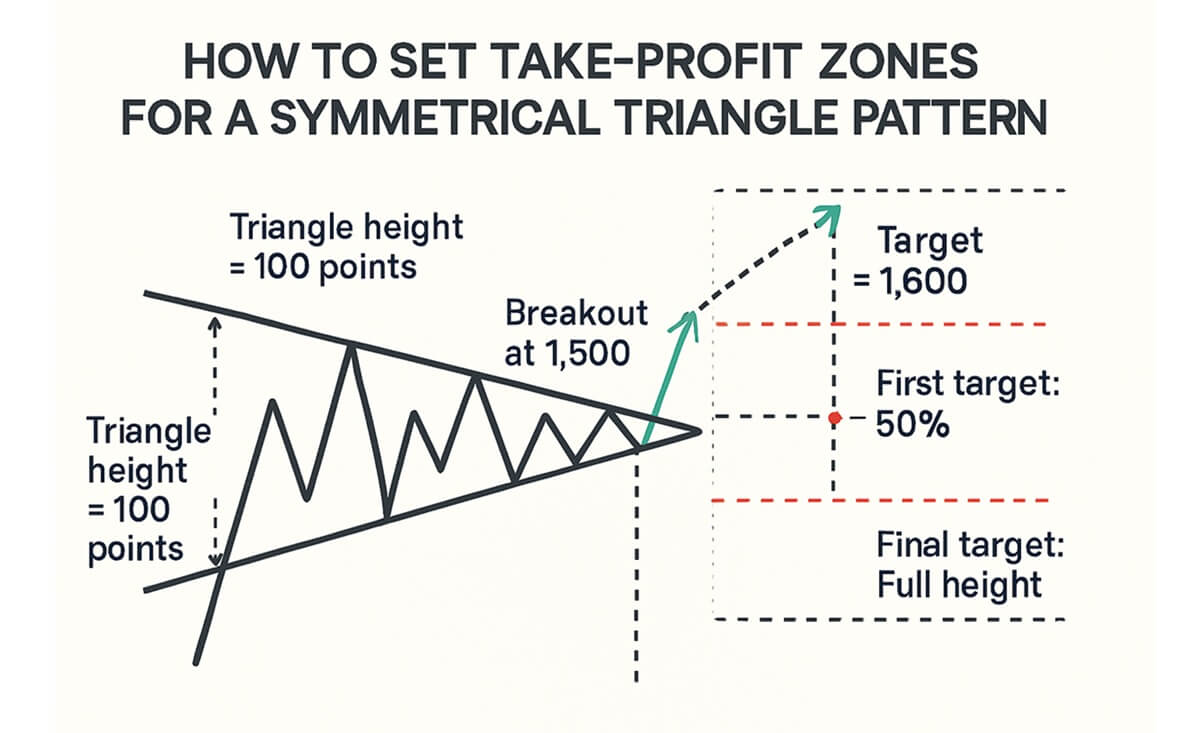 Profit targets for symmetrical triangles are typically calculated using a simple yet effective method: measure the height of the triangle at its widest point and project that distance from the breakout level.
Example:
Traders may also consider multiple targets to scale out of the position. For instance:
First target: 50% of projected move
Final target: Full height projection
Remainder: Trailing stop to capture extended runs
This approach balances reward-seeking with capital protection and aligns with modern risk management best practices.
Managing Risk & Use of Indicators
No pattern guarantees success, which is why effective risk management is the cornerstone of profitable trading. Position sizing based on a fixed percentage of account capital—such as risking 1–2% per trade—helps ensure long-term sustainability.
Indicators can add an additional layer of confidence:
Volume: Confirms breakout legitimacy
RSI: Helps identify overbought/oversold conditions
MACD: Confirms momentum shift during or after breakout
Moving Averages: Can support trend bias before or after breakout
It's also beneficial to backtest the pattern on your preferred asset and timeframe to assess its historical success rate and behavioural nuances.
Final Thoughts
Trading the symmetrical triangle pattern effectively requires more than simply spotting the shape on a chart. It demands discipline, contextual analysis, and risk management. By confirming the trend, waiting for breakout validation, and applying structured entry and exit rules, traders can turn this common formation into a powerful tool.
While no strategy is foolproof, the symmetrical triangle—when traded correctly—offers one of the clearest setups for capturing breakout momentum across all markets.
Disclaimer: This material is for general information purposes only and is not intended as (and should not be considered to be) financial, investment or other advice on which reliance should be placed. No opinion given in the material constitutes a recommendation by EBC or the author that any particular investment, security, transaction or investment strategy is suitable for any specific person.
