Published on: 2025-07-03
Updated on: 2025-09-26
Breakout trading is one of the most powerful strategies in technical analysis. It enables traders to capture significant price movements when an asset breaks out of a well-defined range.
Whether you're trading forex, stocks, commodities, or indices, breakout strategies can offer profitable setups with strong risk-to-reward potential.
In this guide, we'll explore the top 5 breakout trading strategies that work, how to identify a real breakout, and how to avoid false signals. These techniques are suitable for both beginners and experienced traders in 2025.

Breakout trading consists of entering a trade when an asset's price surpasses a specific support or resistance point, accompanied by higher volume. This move typically signals the beginning of a new trend, either bullish or bearish.
The reasoning is straightforward: when a price exceeds resistance or falls below support, it indicates a shift in market sentiment and frequently results in significant directional movement. Traders aim to jump in early to ride the momentum.
As for its importance, breakouts offer some of the most lucrative opportunities in technical trading. Major news events, earnings reports, macroeconomic data, or shifts in market attitudes often trigger breakouts. When the price breaks out of a range, it typically does so massively, enabling traders to seize quick profits.
Breakout trading is also versatile, as traders can utilise it across different timeframes and in various market conditions. From daily charts to 5-minute candles, the core principle remains the same: enter when the price escapes a range.
In forex, breakouts often occur during specific sessions, like the London or New York open. These sessions see spikes in volatility and liquidity, making them prime times for breakouts. Traders often trade breakouts from consolidation during the Asian session.
As for stocks, breakouts are influenced by earnings reports, sector trends, and broader market sentiment. Volume plays a more significant role in stock breakouts compared to forex.
Regardless of the asset, the core principles remain: Pursue consolidation, identify key levels, confirm the breakout, and enter with a plan.

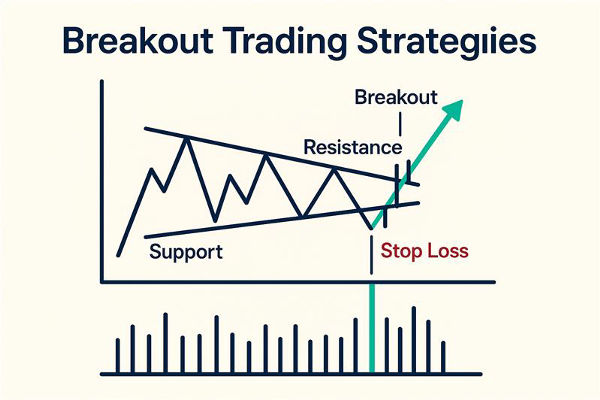
It is the most classic breakout strategy. It involves identifying a horizontal level of support or resistance and waiting for the price to break out above or below it.
For example, if a stock has consistently struggled to surpass $100, that price point turns into resistance. Should the stock ultimately exceed $100 with substantial volume, it indicates a bullish breakout.
Entry is typically placed just above the breakout level, and stop-loss is positioned below the last swing low. The target can be based on the height of the previous range or nearby resistance.
To improve accuracy, traders often wait for a candle to close beyond the breakout point. Volume confirmation is also essential—rising volume during the breakout suggests strong participation and a higher chance of follow-through.
Triangles are continuation patterns that suggest an upcoming breakout. In an ascending triangle, the price forms higher lows while facing horizontal resistance. It signals bullish pressure building up. Once the resistance breaks, the move can be significant.
In a descending triangle, the price forms lower highs while resting on a horizontal support. This setup indicates increasing bearish pressure. A breakdown below the support can lead to a strong downtrend.
To trade these patterns, identify the triangle formation on the chart. Wait for a breakout accompanied by volume. Enter on the break and set your stop-loss below the last low (for bullish breakout) or above the final high (for bearish breakout).
These patterns are especially effective in trending markets, where the breakout often continues the prevailing direction.
Moving averages can likewise detect breakout scenarios when the price surpasses important averages or when two averages converge.
The 50-day and 200-day moving averages are commonly used. A bullish breakout can occur when price crosses above the 200-day average or when the 50-day MA crosses above the 200-day MA—known as a Golden Cross. A bearish breakout occurs when the price drops below the 200-day average or when the 50-day MA falls below the 200-day, known as a Death Cross.
This strategy helps traders confirm a trend change. While it can be slower to signal than other breakout methods, it provides strong confirmation. It's especially beneficial in swing and position trading where long-term trends are crucial.

Bollinger Bands measure volatility. When the bands contract and the price consolidates into a tight range, it creates what's known as a Bollinger Band Squeeze. It signals that a breakout may be imminent.
As volatility diminishes, traders prepare for an abrupt increase. A breakout is likely when the price moves above the upper band or below the lower band, following a spike in volume.
To trade this strategy, wait for a period of narrowing Bollinger Bands and low volatility. Enter when the price breaks out of the range and closes outside the bands with momentum. Set stops near the opposite band and trail them as the trend unfolds.
A highly reliable breakout strategy involves waiting for a retest after the initial breakout. Many breakouts fail on the first attempt, often due to false signals or low volume. By waiting for a pullback to the breakout level, traders can enter with higher confidence.
For example, if the price surpasses a resistance level, it might return later to validate that level as support. If the level holds and price begins to move upward again, it confirms the breakout. It is your cue to enter.
The approach enhances risk management as stops can be positioned right below the level that has been retested. It also prevents traders from jumping in on fakeouts or premature breakouts.
Breakouts can happen across all timeframes, but each has its pros and cons:
Short-term charts (5-min, 15-min): Suitable for day traders. Quick moves but more noise.
Hourly charts: Good balance between speed and clarity. Often used in forex breakout trading.
Daily charts: Suitable for swing traders. Breakouts are more reliable and easier to confirm.
In conclusion, breakout trading is a high-probability strategy when executed with discipline. The five breakout strategies covered here are all proven approaches that traders can apply in 2025.
If you're looking to catch strong market moves with minimal lag, breakout strategies are worth mastering. Start by focusing on one setup, test it extensively, and scale up once you build confidence.
Disclaimer: This material is for general information purposes only and is not intended as (and should not be considered to be) financial, investment or other advice on which reliance should be placed. No opinion given in the material constitutes a recommendation by EBC or the author that any particular investment, security, transaction or investment strategy is suitable for any specific person.