Published on: 2026-06-12
Updated on: 2026-06-12
Historical volatility measures how much an asset’s price has changed over time. It helps traders determine whether a market has been calm, active, or unpredictable over a given period.
When a stock, currency pair, or commodity has had big ups and downs, it has high historical volatility. If its price has remained within a narrower range, its historical volatility is low.

To calculate historical volatility, you look at past price changes over a set period, like 10, 30, or 90 days, or even a year.
A common example is 30-day historical volatility. This looks at how much the price has moved over the last 30 trading days.
Historical volatility is usually shown as a percentage. For example, if a stock’s historical volatility is 25%, it means its price has moved by that amount on an annual basis.
You don’t have to work out historical volatility by hand. Most trading platforms, charting tools, and data providers do the calculation for you.
High historical volatility means the price has moved widely in the past. This can happen during earnings reports, central bank decisions, inflation data, geopolitical events, market panic, or strong trends.
High historical volatility can give traders more chances to trade because prices move more. But it also means there’s more risk. The market can move quickly against you, stop-losses might be triggered sooner, and you may need to use smaller position sizes.
When the market is very volatile, you need to manage your risk more carefully.
Low historical volatility means the price has moved within a smaller range. This may happen during quiet markets, low-volume periods, sideways trading, or consolidation before a larger move.
Low historical volatility can make a market feel calmer, but it does not remove risk. Sometimes, quiet markets become active again when new information appears.
For beginners, the key point is simple: low volatility means recent price movement has been smaller, not that the market is completely safe.
Historical volatility looks backwards. It measures how much the price has already moved.
Implied volatility looks forward. It reflects how much movement the options market expects in the future.
For example, a stock may have low historical volatility because it has moved calmly in recent weeks. But if an earnings report is coming soon, implied volatility may rise as traders expect larger moves ahead.
The simple difference is: Historical volatility shows past movement. Implied volatility reflects expected future movement.

Historical volatility and Average True Range, or ATR, both measure volatility, but they show it differently. ATR shows the average price range in the asset’s own unit, such as dollars, pips, or points. Historical volatility is usually shown as a percentage.
For example, ATR may indicate that a stock moves by about $3 per day. Historical volatility may show that the stock has 30% annualised volatility.
ATR is often easier for stop-loss planning. Historical volatility is useful for comparing movement and risk across different assets.
Traders use historical volatility to understand how active or risky a market has been. It can help traders compare assets, adjust position size, plan stop-loss levels, and avoid treating every market the same way.
For example, a calm stock and a fast-moving stock should not always be traded with the same risk plan. The more volatile asset may need a smaller position size or wider stop-loss.
Historical volatility helps traders prepare for the type of price movement an asset has recently shown.
Implied Volatility: Measures how much movement the options market expects in the future.
Volatility Index: A market indicator that reflects expected volatility, often linked to investor fear or uncertainty.
Risk Management: The process of controlling possible losses before and during a trade.
Stop Loss: An order used to close a trade when the price reaches a selected loss level.
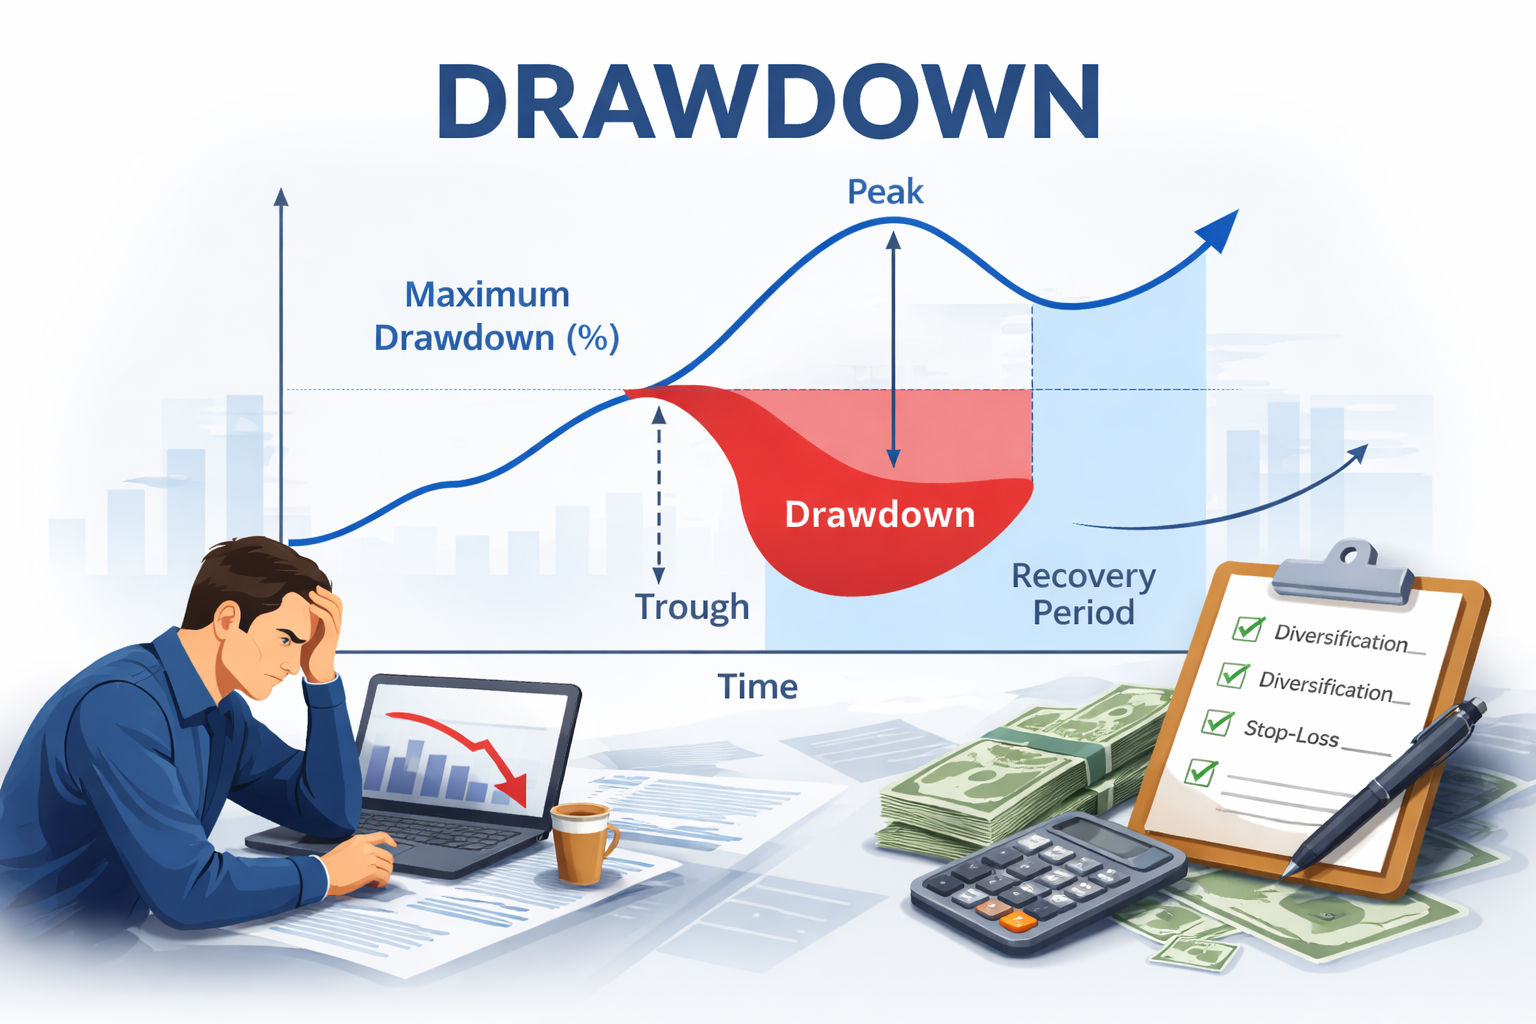
Drawdown: A decline in account value from a previous peak.
Value at Risk: A risk measure that estimates potential losses over a selected period.
No. Historical volatility does not predict whether the price will go up or down. It only measures how much the price has moved in the past. Traders use it to understand risk, not to forecast direction.
High historical volatility means an asset has had larger price swings in the past. This can create more trading opportunities, but it also increases risk because the price may move quickly against a position.
Low historical volatility means the price has moved in a smaller range. The market may be calmer, but it is not risk-free. Low volatility can sometimes appear before a larger breakout or news-driven move.
Historical volatility looks at past price movement. Implied volatility reflects expected future movement, typically derived from options pricing. Historical volatility tells traders what has happened, while implied volatility shows what the market may expect.
Historical volatility measures how much an asset’s price has moved in the past. It helps traders understand whether a market has been calm, active, or unstable.
Historical volatility is useful because it indicates how risky or volatile a market has been recently. It does not predict direction, but it can help traders compare assets, adjust position size, and build better risk plans.