Published on: 2025-10-06
Updated on: 2025-10-06
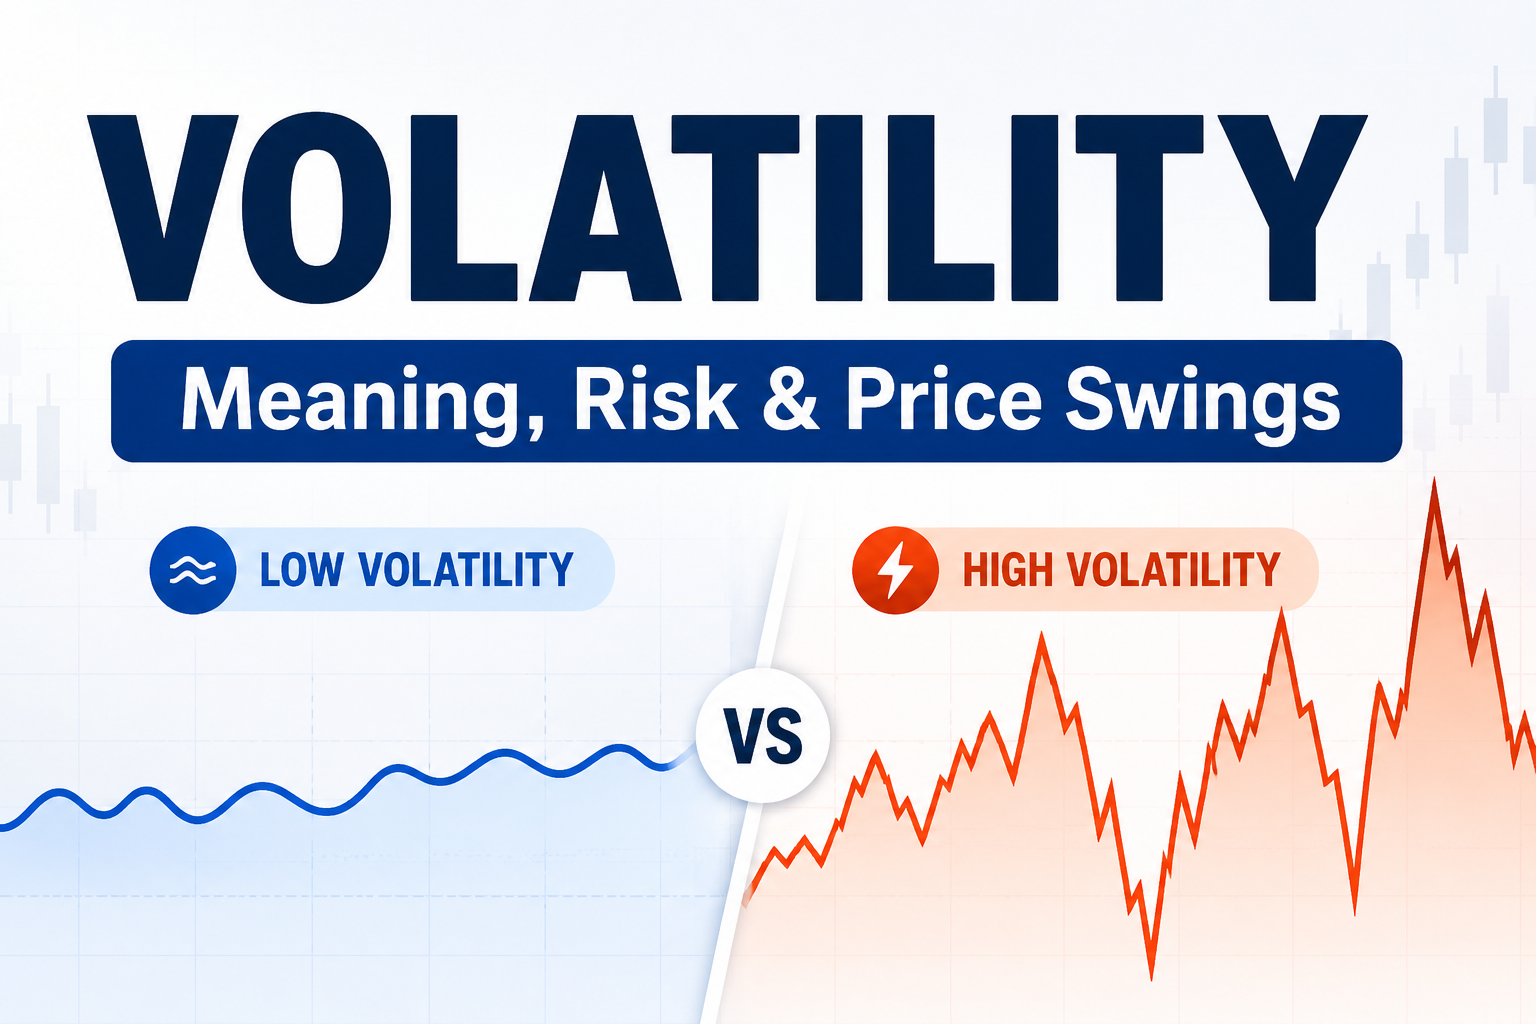
No. Implied volatility measures the expected magnitude of price movement, not direction, and reflects what options traders are willing to pay, not where price will actually go.
It signals uncertainty and potential range rather than predicting outcomes, so it's useful for pricing and positioning but not for forecasting direction.

Implied volatility is the market's estimate of how much an asset's price might move over a given period, derived from current option prices and expressed as an annualised percentage.
It does not reliably predict price moves in terms of direction; it only reflects the expected magnitude of movement in either direction based on what traders are paying for options right now.
So to answer the title directly: implied volatility does not predict where the price will go, but it does show how much uncertainty the market is pricing in.
Implied volatility directly influences option premiums. Higher implied volatility means higher option prices because the market expects larger potential swings, while lower implied volatility means cheaper options and smaller expected moves.
Traders use implied volatility to judge whether options are relatively expensive or cheap, to time entries and exits, and to gauge market sentiment and fear.
The VIX, which tracks implied volatility of S&P 500 options, is often called the market's "fear gauge" because it spikes during stress and uncertainty.
Implied volatility is calculated by working backwards from an option's market price using models such as Black-Scholes, holding all other variables constant.
A stock trading at $100.00 with 20% implied volatility suggests the market expects a one standard deviation range of $80.00 to $120.00 over the next year, with roughly 68% probability.
That means there's a 16% chance the price finishes above $120.00 and a 16% chance it finishes below $80.00, but implied volatility says nothing about which direction is more likely.
| Aspect | Implied Volatility | Historical Volatility |
|---|---|---|
| What it measures | Expected future movement from option prices | Actual past movement from price data |
| Forward or backward | Forward looking | Backward looking |
| Source | Derived from live option market prices | Calculated from historical price changes |
| Predicts direction? | No, only magnitude | No, only past magnitude |
| Use for trading | Price options, gauge sentiment, find mispricing | Benchmark implied volatility, assess if current levels are extreme |
A stock trades at $50.00, and an earnings announcement is due in one month.
Implied volatility on one-month options rises to 40%, meaning the market expects the stock could move roughly plus or minus a range consistent with 40% annualised, adjusted for one month.
A trader who believes the actual move will exceed expectations might buy a $55.00 call for $2.50, expecting implied volatility and the option price to rise if uncertainty grows.
Conversely, a trader who believes the market is overestimating the move might sell options, collecting $2.50 in premium and expecting implied volatility to fall after the event.
If the stock moves $5.00 instead of the implied $10.00 to $15.00, implied volatility will likely collapse and the option seller profits, even though the stock did move.
Major events such as earnings, regulatory decisions, or central bank meetings cause implied volatility to spike beforehand and collapse afterwards, a pattern called implied volatility crush.
Pre-event: implied volatility rises as uncertainty grows and option prices become expensive relative to the potential move.
Post-event: implied volatility drops sharply once the outcome is known, even if the stock moves significantly.
Buyer risk: a trader who buys a call or put can lose money from implied volatility crush, even if directionally correct.
Seller opportunity: short premium strategies profit from the collapse, but risk large losses if the move exceeds expectations.
Defined-risk approach: use spreads or iron condors to limit exposure while still benefiting from implied volatility decline.
Implied volatility should be evaluated in context. A stock with 30% implied volatility may be high for a stable large-cap but low for a volatile small-cap.
Current implied volatility minus 52-week low implied volatility, divided by 52-week high implied volatility minus 52-week low implied volatility, expressed as a percentage.
Number of days in the past year when implied volatility was below the current level, divided by 252 trading days, expressed as a percentage.
Implied Volatility Rank above 50%: current implied volatility is in the upper half of its annual range; consider selling premium.
Implied Volatility Rank below 50%: current implied volatility is in the lower half; consider buying options if directional conviction exists.
Implied Volatility Percentile above 80%: implied volatility has been lower on most days this year; likely elevated and may revert.
Implied Volatility Percentile below 20%: implied volatility has been higher on most days; options may be cheap relative to recent history.
| Mistake | Impact | Fix |
|---|---|---|
| Believing implied volatility predicts direction | Wrong directional bets | Remember: implied volatility measures magnitude only, not direction |
| Buying high implied volatility without context | Overpaying for options that decay fast | Use Implied Volatility Rank (IVR) or Percentile to judge relative levels |
| Ignoring implied volatility crush after events | Losses despite correct direction | Use spreads or sell premium before major events to offset the crush |
| Confusing implied volatility with historical volatility | Misreading signals | Implied volatility looks forward, historical looks backward — compare both for context |
| Treating implied volatility as constant | Surprised by rapid premium changes | Monitor IV daily, especially around earnings or news-driven events |

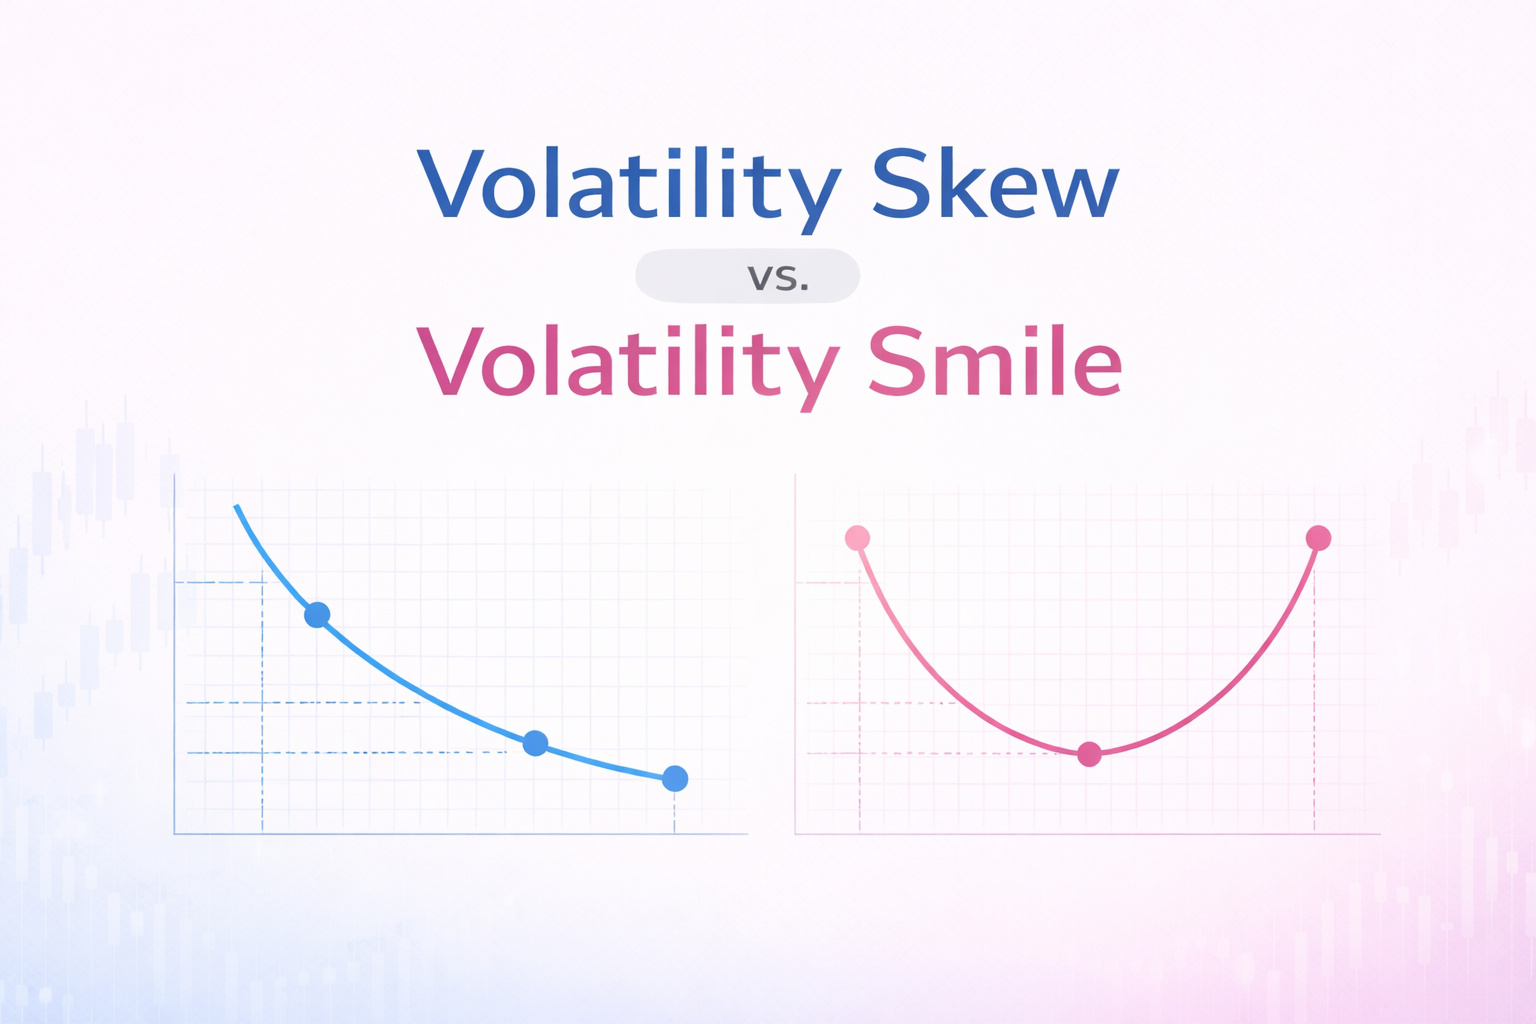
Professionals track implied volatility across strikes and expirations to build a volatility surface, identifying skew and term structure opportunities.
They monitor Implied Volatility Rank and Percentile, trade volatility spreads such as calendars and diagonals, and use realised volatility versus implied as an edge signal.
Pre-earnings, they size positions knowing implied volatility will likely crush post-announcement, so they favour defined-risk structures or sell premium from high implied volatility into the event.
They also compare implied volatility to historical volatility: when implied volatility consistently exceeds realised movement, selling premium can be profitable over time.
Historical Volatility: the actual past price movement of an asset, measured by the standard deviation of returns.
Vega: the option Greek that measures sensitivity to changes in implied volatility; higher vega means bigger price swings per 1% implied volatility change.
VIX: the CBOE Volatility Index that tracks 30-day implied volatility of S&P 500 options, often used as a market fear gauge.
Implied Volatility Rank: a metric that compares current implied volatility to its 52-week range, helping traders judge relative expensiveness.
Implied volatility does not reliably predict price direction, but it does signal expected movement size and market uncertainty.
Use it to assess option value, gauge sentiment, and build strategies around volatility itself rather than as a crystal ball for where price will land.