Published on: 2026-01-20
Updated on: 2026-01-20
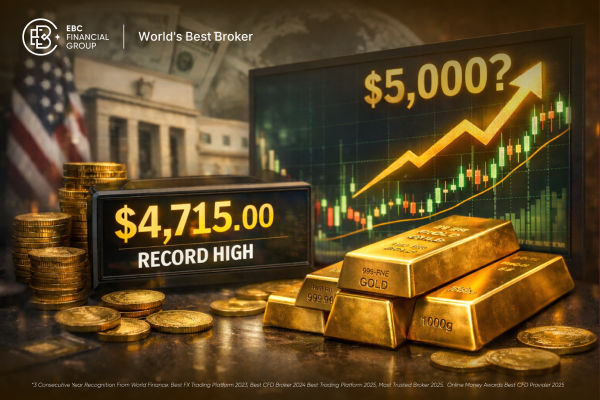
Gold prices have crossed another central psychological line. On January 20, 2026, spot gold reached above $4,700 for the first time, marking a new all-time high of approximately $4,716 per ounce.
 This time, the rally has a clear story: trade war risk is back, markets are uneasy about political pressure on the U.S. Federal Reserve, and investors are still pricing in a path toward easier monetary policy.
The next question is the one everyone asks at new highs: Could gold reach $5,000 soon? The honest answer is yes, it is possible, but the path will not be smooth. Some major banks are already putting $5,000 on the table while also warning that a sharp pullback is a real risk if the macro backdrop calms.
| Market | Level | Date |
|---|---|---|
| Spot gold (XAU/USD) record high | $4,716.90 | Jan 20, 2026 |
| Spot gold high day prior | $4,689.39 | Jan 19, 2026 |
| U.S. gold futures above | $4,706.50 (Feb) | Jan 20, 2026 |
Gold's rise above $4,700 marks another record-breaking milestone in January.
Spot gold pushed past $4,700 to a new high near $4,716.
In the previous session, gold prices reached a record high of $4,689.39, fueled by safe-haven flows amid trade war risks.
Gold had already gained more than 64% in 2025 and was up more than 8% year-to-date before this latest leg higher.
This is not a slow grind. It is a momentum move with a strong fundamental "excuse," which is why pullbacks can be sharp even inside a bullish trend.
This latest surge was a reaction by investors to rising uncertainty tied to U.S. tariff threats against European allies, which hit global risk sentiment and pushed flows into safe-haven assets.

Yes, it is possible, and the math explains why the market is even discussing it.
If gold is around $4,700, a move to $5,000 is:
$5,000 − $4,700 = $300
$300 ÷ $4,700 = 0.0638
That is about 6.4%
A movement of 6% to 7% in gold prices is not uncommon during periods of high volatility. What matters is whether the drivers stay in place long enough for the market to grind higher rather than snap back.
Importantly, Citi Research has set a $5,000 price target for gold in the next three months, citing geopolitical tensions that it expects to remain elevated in the near term.
J.P. Morgan Global Research also published a view that gold prices are expected to push toward $5,000 by Q4 2026, with central bank and investor demand listed among key supports.
The most immediate driver is a surge in risk aversion tied to tariff threats and rising friction between the U.S. and Europe. Investors are flocking to gold as a safe haven while the U.S. dollar weakens due to trade-war concerns.
When trade policy turns unpredictable, markets tend to price a higher risk premium. Gold is one of the fastest ways investors express that.
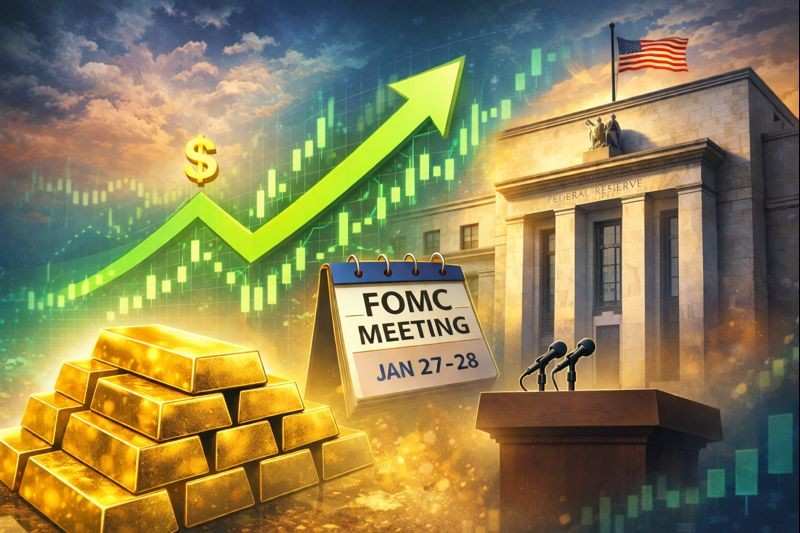
Another crucial factor in the latest gold surge was pressure on the Federal Reserve, including legal moves targeting Fed leadership, which raised concerns about central bank independence.
Gold reacts strongly when investors start to question whether monetary policy will stay predictable. Even a slight shift in that perception can move the market, because gold is priced on trust as much as on inflation.
Gold does not pay interest, so it often benefits when markets expect lower rates. According to our experts, the Federal Reserve is expected to hold rates at its late-January meeting while also noting that market pricing still suggests further cuts later in 2026.
Even if cuts come later, it is the direction that matters. When traders believe the next move is down, gold tends to stay well bid.
Gold's rally has not been driven only by short-term fear. It has also been supported by strong, persistent demand.
The World Gold Council reported that central banks bought a net 45 tonnes in November, taking year-to-date net purchases to 297 tonnes.
On the investment side, the World Gold Council also reported that gold ETF investors added 222 tonnes in Q3 2025, helping push global holdings back toward historic highs.
When those flows stay positive, it becomes harder for gold to fall for long, even after sharp rallies.

A $5,000 level is not "guaranteed," but the conditions that could make it realistic are easy to define.
A $5,000 Move Is More Likely If:
Trade tensions stay unresolved, and risk sentiment remains fragile.
The dollar stays soft, or weakens further, as capital rotates away from risk.
Rate-cut expectations firm up again after softer inflation or weaker growth signals.
ETF inflows and central bank buying remain supportive in the background.
A $5,000 Move Becomes Harder If:
Trade risk cools quickly, and markets shift back to "risk-on."
U.S. data turns stronger, pushing yields higher and trimming bets on a rate cut.
A sharp profit-taking wave hits leveraged positioning, forcing liquidations.
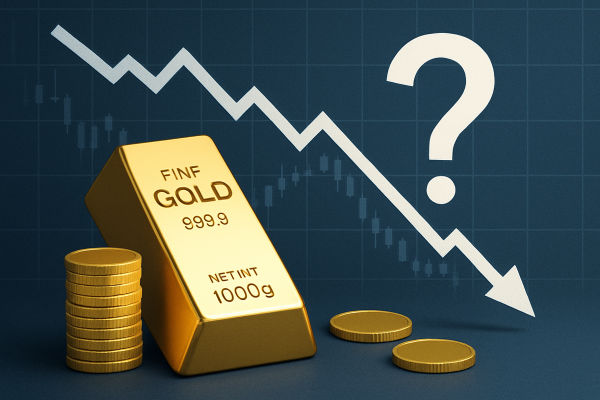
However, there is still pullback risk, as gold fell more than 1% on January 16 as investors booked profits and geopolitical tensions appeared to ease.
As mentioned above, a move from $4,700 to $5,000 is approxinately 6.4%. That is not a huge percentage in a market that has already been moving 1%–2% in a day at times, but the path will not be smooth.
| Scenario | What needs to happen | What it would look like in markets |
|---|---|---|
| Fast push (weeks) | A fresh shock lifts safe-haven demand and keeps yields contained | Sharp rally, wider daily ranges, quick tests of $4,800 then $5,000. |
| Grind higher (months) | Rate-cut pricing strengthens and ETF/official demand stays firm | Smaller daily moves, repeated dips bought near $4,700. |
| False break (pullback first) | Tension cools or yields jump | Quick drop back into the $4,600s, then a base-building phase. |
A rise to $5,000 by 2026 is possible, but when it happens depends on the market's continued pricing of easier policies and whether ongoing risk news maintains safe-haven demand.
The move becomes far more likely if gold can hold $4,700 as a durable floor, because that would signal the market is no longer selling strength at old highs.
| Indicator | Latest | Signal |
|---|---|---|
| Technical summary | Strong Buy | Trend bullish |
| RSI (14) | 71.158 | Buy (near stretched) |
| MACD (12,26) | 15.34 | Buy |
| ADX (14) | 35.909 | Buy (trend strength) |
| Stoch RSI (14) | 100 | Overbought |
| ATR (14) | 11.6363 | Volatility remains meaningful |
| MA50 (simple) | 4637.34 | Buy |
| MA200 (simple) | 4571.27 | Buy |
Gold's chart is still pointed higher, but momentum is stretched. That does not mean the uptrend is over. It means short-term pullbacks can be sudden.
Overall, the trend remains upward, but the market is stretched enough that sharp pullbacks can occur even if the larger move continues to be bullish.
| Level | Price |
|---|---|
| Support (S1) | 4684.37 |
| Pivot | 4690.73 |
| Resistance (R1) | 4701.63 |
| Resistance (R3) | 4718.89 |
How Should You View This: If gold holds above the pivot region after a spike, buyers often defend dips. If it drops below support and stays there, the market usually cools off before the next push.
A sudden rise in real yields
A stronger dollar
Crowded positioning and forced profit-taking
Safe-haven demand fades
Gold broke $4,700 as trade-war risk and policy uncertainty increased safe-haven demand, while the U.S. dollar softened and rate-cut expectations stayed supportive.
Yes, it is realistic, but not guaranteed. HSBC forecasts that gold could reach $5,000 in the first half of 2026, while J.P. Morgan anticipates a move toward $5,000 by the fourth quarter of 2026.
Daily technical readings indicate the RSI is just above 70, and the Stoch RSI is at 100, both reflecting stretched momentum. While this can occur in strong uptrends, it heightens the risk of a pullback.
The most significant risk is a jump in yields or a shift in Fed expectations that delays cuts. Gold can drop quickly if markets suddenly reprice rates higher.
In conclusion, gold breaking above $4,700 clearly signals that investors are willing to pay more for protection. The move is being supported by trade-war risk, a softer U.S. dollar, and expectations that rates will trend lower later in 2026, with steady central bank buying in the background.
A surge to $5,000 is not a fantasy. It is only about a 6% move from $4,700, and major banks have already set a $5,000 target for the next three months.
Still, gold is priced for uncertainty, which makes pullbacks more likely if headlines cool or profit-taking hits leveraged positions.
Disclaimer: This material is for general information purposes only and is not intended as (and should not be considered to be) financial, investment or other advice on which reliance should be placed. No opinion given in the material constitutes a recommendation by EBC or the author that any particular investment, security, transaction or investment strategy is suitable for any specific person.