Published on: 2026-09-02
Updated on: 2026-09-02
The US 10-year Treasury yields 4.80%, the 10-year gilt 5.25%, and Japan’s 10-year JGB touched 3% on 1 September for the first time since 1996.

The Federal Reserve, the Bank of England and the Bank of Japan are at different points in different cycles. Their bonds are falling together anyway. What connects them is the price of lending to a government for a decade, which has risen everywhere for reasons only partly shared.
A bond selloff and a yield rise are the same event, seen from opposite ends of the trade.
Investors are demanding a larger term premium, the payment for holding long-dated debt through an uncertain decade.
Global capital links the three markets, so a repricing in one spreads to the others.
Japan’s 3% is a smaller number than Britain’s 5.25%, yet it marks the bigger regime change.
Long yields can stay high even after a central bank changes direction.
Government yields set the base rate for equities, currencies, gold and private borrowing.
An investor holds a 10-year bond bought when the market expected rates to drift lower. Expectations changed, and new debt pays more. Who wants the older bond at the older price?
Fewer buyers. Its price falls until the return matches a fresh bond. A selloff and a rise in yields are one event seen from either side, and the bond market quotes both.
Three forces are compounding. The first is that inflation is unpredictable again. Brent traded above $92 a barrel on 1 September after renewed US and Iranian strikes near the Strait of Hormuz, and past $95 the next day.
Bond coupons are fixed, so inflation running hotter than forecast erodes every remaining payment. What unsettles investors is less the level of inflation than the width of the range around it.
The second is supply. US federal debt passed $40 trillion in August, Britain’s sits near 95% of GDP and Japan’s above 200%. More paper needs more buyers, and buyers set the price.
The third is that policy has changed direction. Markets price roughly a two-thirds chance of a Federal Reserve hike this month, after Chair Kevin Warsh signalled at Jackson Hole that the inflation job was unfinished. A year of assuming rates only fall has unwound in weeks.
A 10-year yield is not a forecast of where a central bank will set rates. It is the expected average policy rate over the decade, plus a payment for accepting risk over that horizon: inflation stays higher, issuance grows, prices swing. That payment is the term premium, and it is widening.
The evidence is in the shape of the curve. The US 30-year closed at 5.27% against a 2-year at 4.36%, and the 30-year gilt reached its highest since 1998. When the long end moves faster than the short end, the market is not revising its view of next month’s meeting; it is charging more for uncertainty.
An older name for the behaviour: a bond vigilante sells sovereign debt to press a government it judges to be borrowing recklessly. The label names a motive, the term premium measures it.
Bond markets are linked by capital, not policy. If Treasuries offer meaningfully more, an investor holding gilts or JGBs has a better-paid alternative on the screen, portfolios rebalance, and yields elsewhere get dragged along.
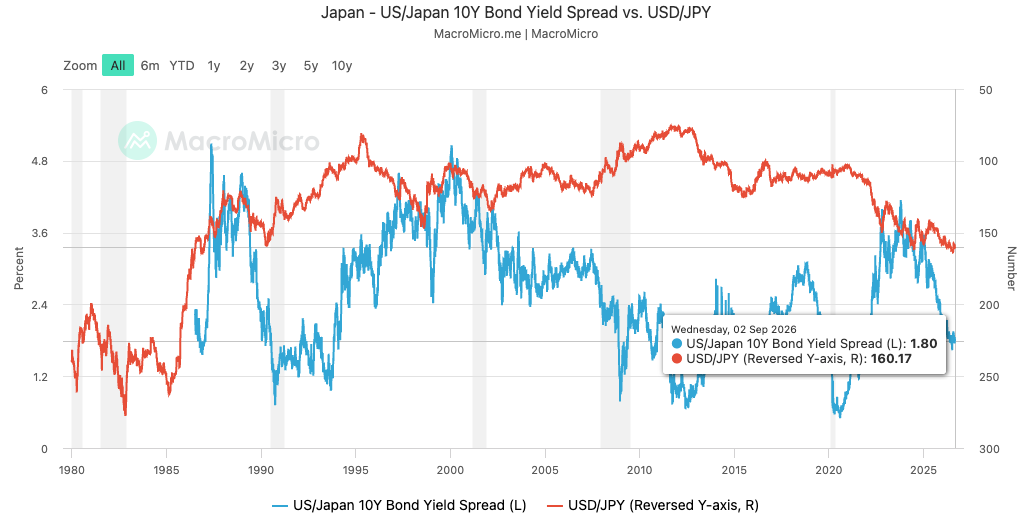
Two newer pressures act on the same pool of money. Corporations are issuing record volumes of long-dated debt to fund AI infrastructure, with global issuance at $4.9 trillion so far in 2026, and every dollar absorbed there is one not bidding for government paper.
The second runs in reverse. Near-zero yields at home once pushed Japanese institutions abroad, making Japan the largest overseas holder of Treasuries. At 3% that calculation weakens, and money staying in Tokyo is demand that vanishes from Washington and London. Countries set their own policy; global investors decide where capital goes.
| Market | 10-year yield | Last seen | Policy direction | Local amplifier |
|---|---|---|---|---|
| US Treasuries | 4.80% | Jan 2025 | Hike back on the table | Deficit funding, long-end supply |
| UK gilts | 5.25% | 2008 | Tightening priced by year-end | Index-linked debt, Budget risk |
| Japan JGBs | 3.00% | 1996 | Normalising from 1% | Fiscal expansion on 200%+ debt |
The American amplifier is a repricing of the whole policy path. Energy costs have revived inflation risk and the labour market has stayed firm, so a hawkish Fed chair has put a hike back on the table.
The Treasury keeps funding large deficits: August’s 30-year auction cleared at the highest yield since 2001, and buybacks aimed at the long end are modest against that supply.
Why is Britain 45 basis points above the US? Because a global shock lands harder where domestic weaknesses exist.
Britain carries one of the heaviest debt-servicing burdens in half a century, and close to a quarter of gilts in issue are inflation-linked, the largest share of any major developed economy, so an oil shock raises its interest bill automatically, with no new bond issued.
Japan’s 3% is the lowest of the three, yet it marks the largest break with the past. Japanese yields spent three decades near zero, held down by an ultra-loose central bank and yield control. The benchmark has tripled in two years, the 2-year at a 31-year peak of 1.81%.
Three forces drive it: the Bank of Japan is normalising with a September hike near certain; inflation has proven durable with the yen near ¥160; and an expansionary fiscal agenda has raised doubts about how debt above 200% of GDP behaves once borrowing is no longer free. August’s 10-year auction drew the weakest demand in a year.
The UK has the highest yield. Japan has the biggest regime change.
The simple model says hikes push yields up and cuts pull them down. It is incomplete. In late 2024 the Federal Reserve began cutting and the 10-year rose anyway, because the term premium widened faster than rate expectations fell. The 1994 bond massacre is the mirror image. Either way, long yields can stay high while deficits are large and issuance heavy.
An overnight rate is a lever on the front end and does not settle who buys the thirty-year bond. The question may no longer be how high policy rates go, but how expensive governments must make long-term debt before investors own it.
Cheaper oil is the fastest route: it narrows the range of inflation outcomes and takes hikes off the table at once, which makes Hormuz rather than the Fed the nearest thing to a switch. Softer inflation data works on the expected rate path alone, pulling the front end down and steepening the curve while leaving the long end where deficits have put it.
The term premium unwinds more slowly. Strong auction demand would show buyers returning without further concession, and credible fiscal plans would cut expected issuance, but neither is settled by one print.
So the selloff is likelier to fade in stages than reverse: the rate-path leg can turn on one release, the premium leg on whether governments are believed.
Government yields are the benchmark for almost everything else. Equity earnings get discounted at a higher rate, and bonds have looked more worried than stocks through this oil shock. Growth stocks whose value lies furthest ahead are most sensitive, which is why chipmakers and AI names led the retreat.
Currencies move on shifting yield differentials, which is why the yen has drawn official attention. Gold carries a higher opportunity cost when real yields rise, and mortgages and corporate credit price over government debt, so the floor has risen for borrowers.
OPEC+ meets on 6 September. The Bank of England decides on 17 September, the Bank of Japan on 17 and 18 September, and the Federal Reserve later that month, with a US hike now the base case rather than the tail risk. Auctions run throughout, and Britain’s Budget on 28 October is the next fiscal test.
This is not three bond markets falling at once. It is a global repricing of what investors need to be paid for inflation, duration and fiscal risk, with local pressures deciding how far each yield travels.
That changes what to monitor. Auction results, deficit projections and the oil price now say more about long yields than any policy statement, which is why a move in gilts stops being a British story and becomes a signal for anyone holding equities or gold.
This article is for educational purposes and does not constitute investment advice. Market levels cited are as of the 1 September 2026 close, with moves on 2 September noted where relevant.