Published on: 2025-06-10
Updated on: 2025-06-10
In technical analysis, Chart Patterns are invaluable tools for predicting market direction. One of the more complex but rewarding patterns is the Diamond Chart Pattern.
Although less commonly discussed than triangles or other formations, the diamond pattern can offer powerful insights into trend reversals or continuations when identified correctly.
In this guide, we'll explore everything a trader needs to know about diamond pattern trading. From identifying its structure to executing trades and managing risks, this article will help enhance your trading repertoire.

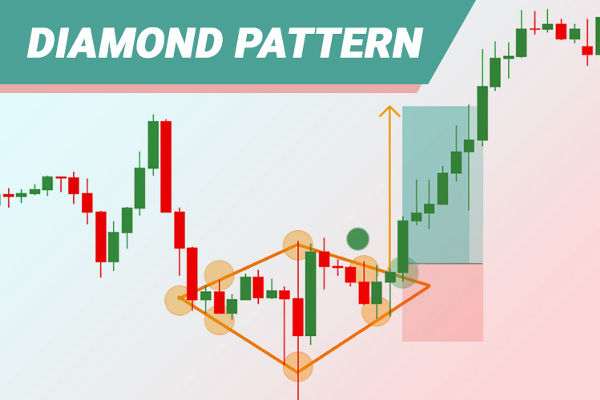
A diamond pattern is a technical chart formation that resembles the shape of a diamond or rhombus when viewed on a price chart. It typically forms after an extended trend, either up or down and signals a potential reversal.
This pattern is formed by a broadening formation followed by a contracting formation, making it appear like a diamond at the top or bottom of a trend. It is often found near market tops or bottoms and represents a shift in market psychology from indecision to decisive breakout.
There are two main types of diamond patterns:
Diamond Top: Forms at the end of an uptrend and indicates a potential bearish reversal.
Diamond Bottom: Forms at the end of a downtrend and suggests a bullish reversal.
Understanding the underlying structure of this pattern can help traders time their entries more effectively and manage trades with greater precision.
A diamond chart pattern is not a simple geometric shape drawn arbitrarily—it's based on price behaviour that reflects market indecision and eventual resolution. It usually consists of four phases:
1. Broadening Phase
This initial phase displays price volatility expanding. Highs and lows are separated apart, forming a megaphone-like shape. It indicates market uncertainty, with neither buyers nor sellers in control.
2. Contraction Phase
After the broadening, the price begins to form lower highs and higher lows, gradually contracting. It forms the second half of the diamond and suggests the market is preparing for a breakout.
3. Support and Resistance Formation
A horizontal or slightly sloped neckline is drawn at the base of the diamond, which acts as the breakout level. The price must close beyond this level for the pattern to be confirmed.
4. Breakout
The breakout occurs in the direction opposite to the prevailing trend. In a diamond top, the price breaks down; in a diamond bottom, the price breaks up. A surge in volume often confirms the breakouts.
Diamond formations typically emerge on longer timeframes such as daily, weekly, or monthly charts, although they can sometimes be seen on intraday charts.
They are most impactful when created following a significant directional shift and are deemed more trustworthy in assets with higher trading volumes.
Markets where diamond patterns often occur:
Major stock indices (e.g., S&P 500, Nifty 50)
Commodities (e.g., gold, crude oil)
Forex pairs (e.g., EUR/USD, USD/JPY)
Since the pattern reflects a transition phase in market sentiment, it is often associated with key economic events, earnings reports, or geopolitical developments.

Steps to Identify the Pattern:
Start with a Trend: Search for a strong uptrend or downtrend prior to the pattern. Diamond tops require a strong preceding uptrend; diamond bottoms need a prior downtrend.
Locate the Broadening Formation: Determine a price range in which volatility increases. Lows are declining further, and highs are rising higher.
Look for Contraction: Watch for the pattern to shift into a narrowing formation. Price starts making lower highs and higher lows.
Draw Boundary Lines: Connect the highs and lows with trendlines to form the diamond shape.
Identify the Breakout Level: Draw a horizontal support or resistance level at the edge of the pattern.
Wait for Confirmation: A confirmed breakout with strong volume completes the pattern and indicates the potential direction of the move.
Since diamond patterns can be confused with head and shoulders or triangles, it's crucial to assess them in context and confirm the structure with proper volume and trend analysis.
Real-World Example of a Diamond Pattern
Let's consider an example from the gold (XAUUSD) market:
Suppose gold rallies to $2,100 per ounce and then enters a volatile phase.
The price fluctuates between $2,120 and $2,050 for several days, then begins to narrow down with smaller fluctuations between $2,070 and $2,060. A diamond pattern emerges, and finally, the price falls beneath $2,060, accompanied by a significant volume.
It would signal a diamond top formation with a likely bearish reversal. Traders might enter short positions around $2,060 with a stop above $2,085 and a target near $2,010, depending on the pattern height.
These real-time patterns frequently necessitate swift decisions and straightforward guidelines.

| Aspect | Diamond Top Pattern | Diamond Bottom Pattern |
|---|---|---|
| Trend Preceding Pattern | Strong uptrend | Strong downtrend |
| Market Signal | Bearish reversal | Bullish reversal |
| Pattern Shape | Expanding followed by contracting price highs and lows, forming a diamond shape at the top | Similar shape but appears at the bottom of a downtrend |
| Volume Behavior | High during expansion, low during contraction, then spike on breakdown | High during expansion, low during contraction, then spike on breakout |
| Breakout Direction | Downward | Upward |
| Entry Trigger | Break below the lower boundary (support line) | Break above the upper boundary (resistance line) |
| Stop Loss Placement | Just above recent lower high within the pattern | Just below recent higher low within the pattern |
| Profit Target | Height of the pattern subtracted from breakout point | Height of the pattern added to breakout point |
| Ideal Confirmation Tools | Volume spike, rsi divergence (bearish), MA crossover | Volume spike, RSI divergence (bullish), MA crossover |
| Risk Level | Moderate to High (false breakouts possible) | Moderate to High (false breakouts possible) |
| Best Timeframe | Daily or above for reliability | Daily or above for reliability |
Diamond Pattern vs Other Reversal Patterns
Traders often compare the diamond pattern to more popular structures like:
1) Head and Shoulders
Similar in reversal behaviour but differs in symmetry
Head and shoulders are cleaner and more common
2) Broadening Wedges
Share the expanding structure but lack the contraction phase.
3) Triangles
Typically, continuation patterns with more predictable breakouts
While diamond patterns are rarer, they often offer better reward-to-risk setups due to the depth of consolidation.
In conclusion, the diamond chart pattern is a sophisticated and lesser-known technical structure that can offer exceptional trading opportunities for those who can spot it early.
Whether it's a diamond top indicating a potential sell-off or a diamond bottom suggesting a reversal to the upside, understanding this pattern adds a powerful tool to any trader's arsenal.
Disclaimer: This material is for general information purposes only and is not intended as (and should not be considered to be) financial, investment or other advice on which reliance should be placed. No opinion given in the material constitutes a recommendation by EBC or the author that any particular investment, security, transaction or investment strategy is suitable for any specific person.