Published on: 2025-06-12
Updated on: 2025-06-12
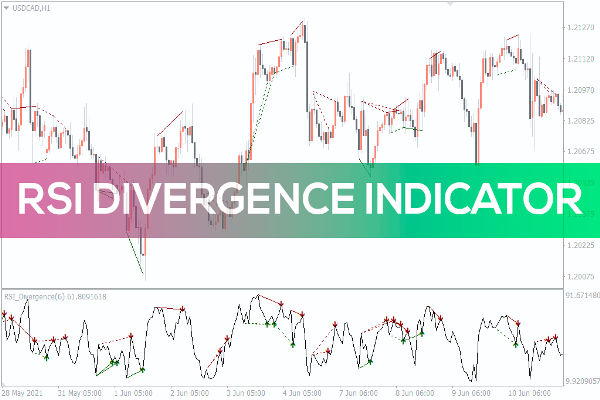
Technical analysis is the backbone of many successful trading strategies, and one of the most powerful tools in a trader's arsenal is the Relative Strength Index (RSI). Within RSI's range of uses, divergence stands out as a reliable method for spotting potential trend reversals.
This article will walk you through what RSI divergence is, why it matters, and how you can use it to time the market more effectively like a pro trader.

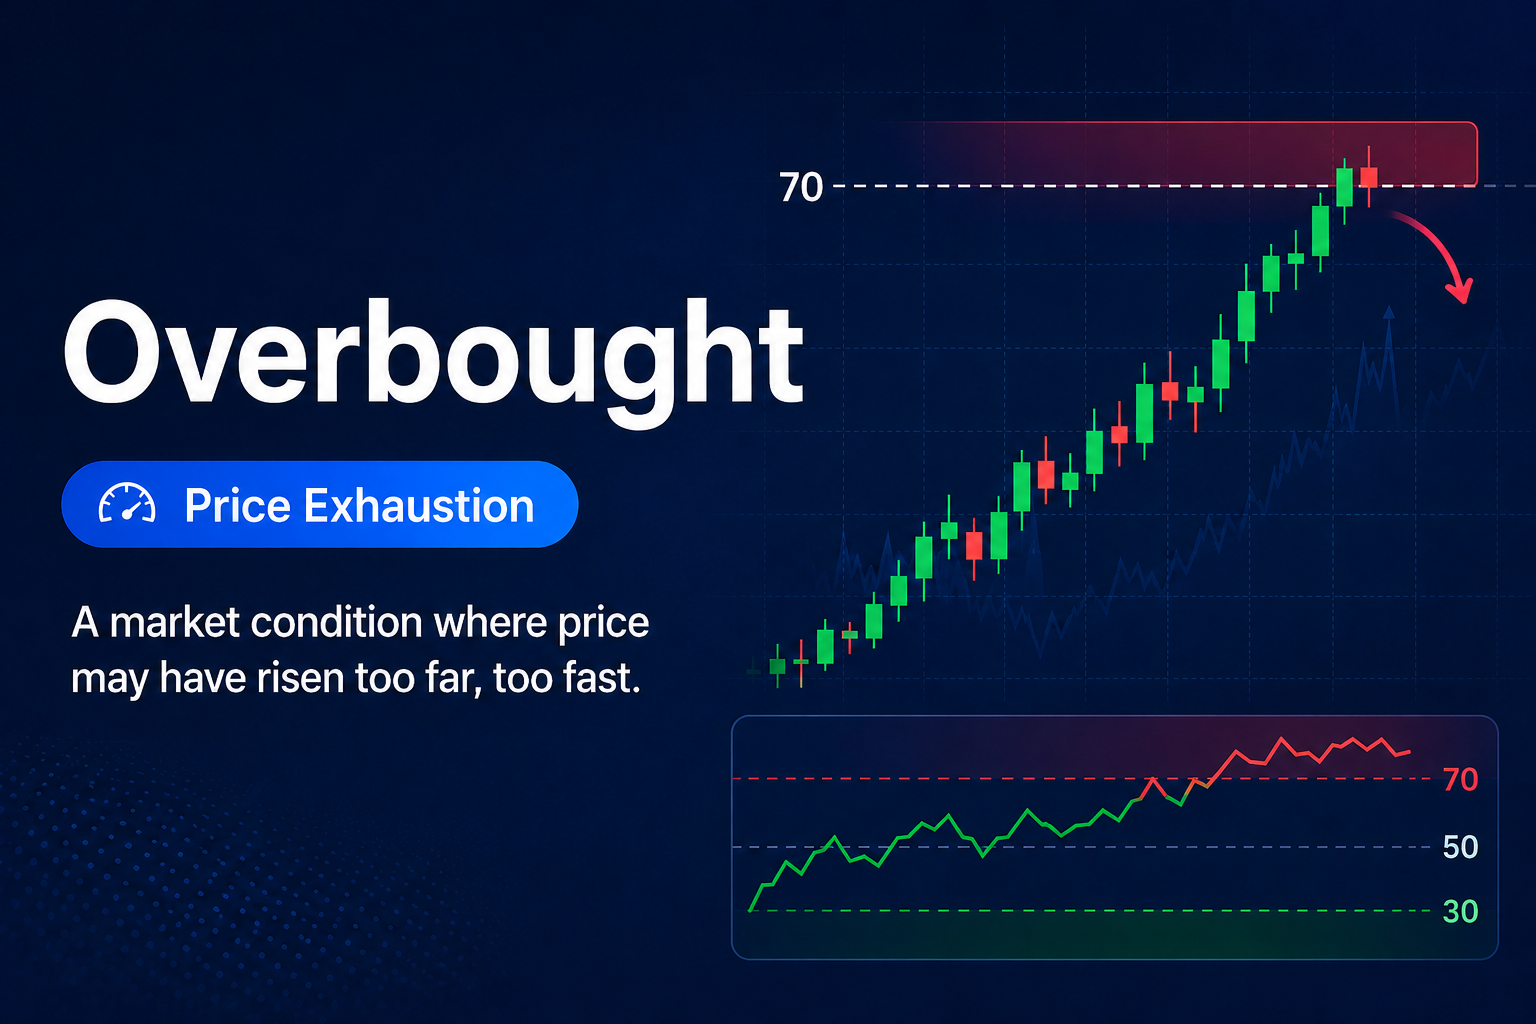
The Relative Strength Index (RSI) is a momentum oscillator developed by J. Welles Wilder. It measures the speed and change of price movements, typically ranging from 0 to 100. When the RSI is above 70, the market is generally considered overbought; when below 30, it is seen as oversold.
But RSI is more than just an overbought/oversold indicator. It provides insights into market momentum, and divergence with price can reveal hidden clues about potential trend shifts.
Regular vs Hidden Divergence
Divergence can be further categorised into regular and hidden divergence. Regular divergence is commonly linked to reversals in trend, whereas hidden divergence indicates the continuation of a trend.
A typical bullish divergence appears during a downtrend, suggesting that a bullish reversal could occur. A typical bearish divergence takes place during an uptrend and indicates an impending downward reversal.
On the other hand, a hidden bullish divergence occurs when the price forms a higher low while the RSI creates a lower low. It signals that the upward trend will continue.

RSI divergence occurs when the price of an asset moves in the opposite direction of the RSI. In other words, while the price may be making higher highs or lower lows, the RSI does not confirm that move. This inconsistency often signals a weakening trend and the possibility of a reversal.
There are two main types of RSI divergence:
Bullish Divergence: Price forms lower lows, but RSI forms higher lows. This suggests that selling pressure is weakening.
Bearish Divergence: The price makes higher highs, but the RSI creates lower highs. It implies fading buying strength.
These patterns are especially useful in volatile or trending markets, where traders seek early signs of a shift.
Setting Up RSI for Divergence Analysis
To use RSI for Divergence Trading, most traders stick with the standard 14-period setting. However, depending on your trading style, you can adjust the RSI period accordingly. A shorter period (like 7 or 9) makes the indicator more sensitive, while a longer period (21 or 28) smooths out fluctuations.
Apply the rsi indicator to your chart and watch for divergence patterns to form between the RSI line and the price. Divergence is best spotted using line or bar charts with a clean background to eliminate distractions.

Here's how you might approach a bullish RSI divergence:
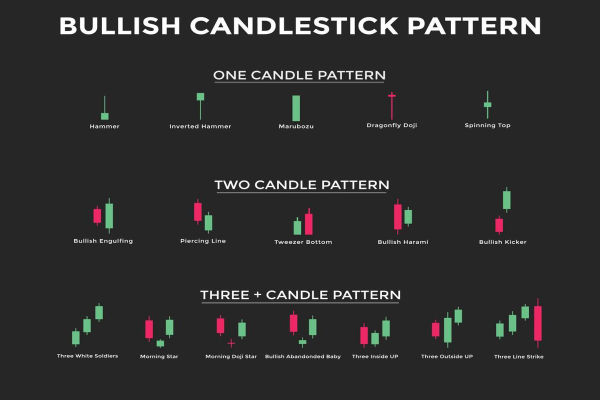
When the price of an asset is making lower lows, but the RSI is making higher lows, this could signal that bearish momentum is slowing. A trader would then look for confirmation via a candlestick reversal pattern or a breakout above a key resistance level.
Once confirmation is received, the trader enters a long position and sets a stop loss below the most recent swing low. The take-profit target could be based on previous resistance or Fibonacci retracement levels.
For instance, in forex trading, if EUR/USD is forming a descending wedge and RSI divergence appears on the 4-hour chart, that could present a prime long opportunity.
Conversely, if the price makes higher highs but the RSI prints lower highs, the trader watches for signs of trend exhaustion. A bearish candlestick pattern, such as a shooting star or an evening star, can serve as confirmation.
Upon confirmation, a trader might short the asset or close their long positions. Traders can place a stop-loss above the latest swing high, and targets can align with recent support levels or pivot points.
In equity markets, a bearish RSI divergence on high-flying tech stocks after a strong earnings rally can be a signal to take profits or go short.

1) Entry and Exit Rules
Precise entry and exit rules make RSI divergence strategies more consistent.
A typical entry rule would involve:
Waiting for divergence to form and confirm using price action or candlestick patterns
Entering at the close of the confirmation candle
Exit strategies might include:
Taking partial profits at the nearest support/resistance level
Using trailing stops to lock in gains as the price moves favourably
Exiting when RSI re-enters neutral levels (typically 50) after hitting extremes
2) Confirming Divergence with Volume and Trend Tools
Volume can be a powerful confirmation tool. When divergence accompanies a dropping volume on price continuation, it suggests waning momentum.
For example, a bearish divergence paired with shrinking volume on new highs reinforces the idea of a potential pullback. Similarly, a bullish divergence with decreasing sell volume shows that sellers are losing control.
Trend tools such as moving averages (especially the 50 EMA or 200 SMA) help filter divergence setups. If a bullish divergence occurs above the 200-day moving average, it carries more weight than one in a downtrend below it.
RSI divergence strategies work across multiple time frames. For scalping and intraday trading, divergence on 5-minute or 15-minute charts can offer quick trading opportunities. However, signals on lower time frames tend to be less reliable due to noise and false positives.
Swing traders often look for divergence on the 1-hour or 4-hour charts, which provide more meaningful setups with stronger trend indications. Position traders might analyse the daily or weekly RSI for long-term reversal opportunities.
It's also common to combine time frames—using higher time frames for trend direction and lower ones for entries based on divergence.
Real World Case Studies
Case 1: Bullish Divergence in Crude Oil
In early 2023, WTI crude oil prices made new lows around $65 per barrel. However, the RSI on the daily chart showed a higher low.
This bullish divergence coincided with oversold RSI levels and a hammer candlestick pattern, signalling a reversal. Prices subsequently rallied to $85.
Case 2: Bearish Divergence in NASDAQ-100
In a tech rally in mid-2024, the NASDAQ-100 reached higher peaks, yet the RSI indicated persistently lower peaks on the daily chart. This negative divergence occurred before a 7% drop, offering short-sellers and profit-takers a crucial indicator.
These examples underscore the utility of RSI divergence across different asset classes and trading styles.
In conclusion, the RSI divergence is a powerful signal. However, traders should avoid using it in isolation. Market context, price structure, and volume analysis all enhance the effectiveness of divergence setups.
As 2025 presents a mix of volatility, opportunity, and rapid technological advancements in financial markets, mastering divergence-based strategies will be more valuable than ever.
Disclaimer: This material is for general information purposes only and is not intended as (and should not be considered to be) financial, investment or other advice on which reliance should be placed. No opinion given in the material constitutes a recommendation by EBC or the author that any particular investment, security, transaction or investment strategy is suitable for any specific person.