Published on: 2025-05-27
Updated on: 2025-09-25
The financial markets often feel like a battlefield where retail traders and institutions collide. Many beginners believe that price moves based on "supply and demand", but in reality, large institutions, hedge funds, and algorithms are constantly shaping price through liquidity hunts and stop-loss sweeps.
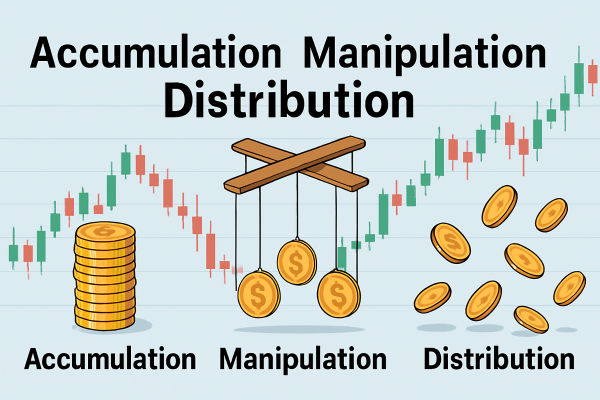
This is where the Accumulation Manipulation Distribution (AMD) model comes in. Sometimes linked to Smart Money Concepts (SMC) and the Wyckoff method, AMD describes how institutional traders accumulate positions, manipulate liquidity, and then distribute holdings for profit.
In modern trading, AMD remains especially relevant. With AI-driven trading algorithms, heightened volatility in forex, stocks, and crypto, and increasing liquidity games, understanding AMD is more crucial than ever.

Although numerous traders oversimplify AMD to "buy low, sell high," the truth is more tactical. Let's break it down:
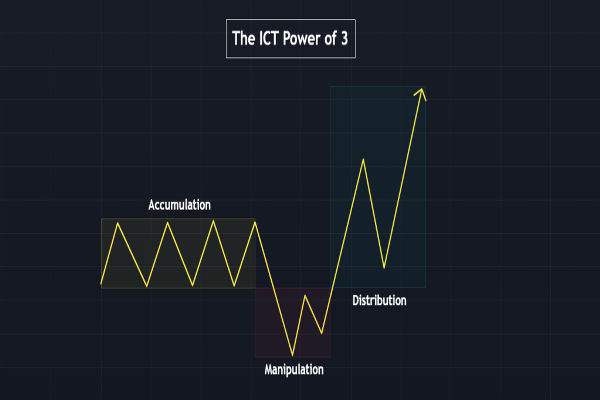
The accumulation phase occurs after a downtrend, when fear is high and retail traders give up. Institutions begin buying quietly, keeping prices stable to avoid attracting attention.
Signs of Accumulation:
Prices move sideways in a tight range.
Volume increases slightly but without significant price fluctuations..
News sentiment is negative, keeping most traders bearish.
Example (Crypto 2021–2024): Following the 2022 crypto collapse, Bitcoin stabilised within the $15,000–$20,000 range. Institutions built their positions, while retail traders remained on the sidelines. By 2025, BTC surged above $120,000.
In the manipulation phase, big players create sudden price spikes or dips to confuse traders and trigger stop-loss orders.
Signs of Manipulation:
False breakouts above resistance or below support.
Sharp moves on low news impact.
Increased volatility with no clear trend.
This phase often tricks retail traders into buying high or selling low, handing liquidity to institutions.
Example (Stocks 2020): During COVID-19 news shocks, many stocks saw "fake rallies" that lured traders in before collapsing again. Institutions used this volatility to increase positions at low costs.
Once prices rise significantly, institutions start unloading their positions to latecomers. Retail traders, seeing headlines about "new highs," rush to buy, but they're buying at the top.
Signs of Distribution:
Prices hit new highs, but volume doesn't increase.
"Too good to be true" bullish sentiment in news and social media.
Repeated rejections at resistance levels.
Example (Tech Stocks 2021): Tesla and Zoom saw massive rallies. Media hype fueled retail buying, but institutions began distributing shares. Later, many stocks corrected sharply.

Accumulation: Big money buys low while retail investors avoid.
Manipulation: Sudden volatility shakes out small traders.
Distribution: Prices rise, retail rushes in, institutions sell.
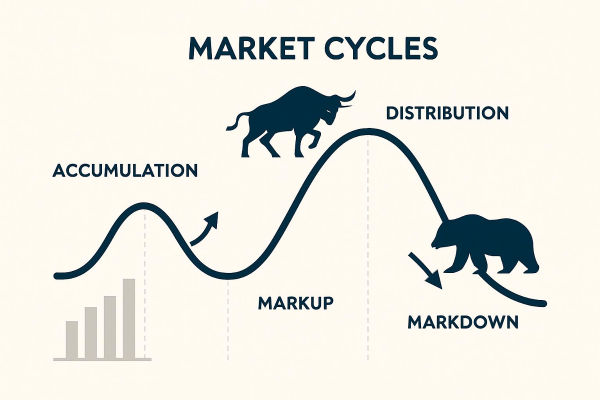
This cycle repeats across stocks, forex, commodities, and crypto. Traders who recognise it can avoid traps and trade alongside institutions.
In Accumulation, avoid over-leveraging; prices may stay sideways longer than expected.
In Manipulation, use wider stops and smaller positions.
In Distribution, trail your stops to protect profits.
Risk management ensures you survive fakeouts and profit when real moves begin.

Spotting AMD in real time is difficult but possible with the right tools. For example:
Declining volume → Accumulation.
Sudden spike → Manipulation.
High but tapering volume → Distribution.
Look for stop-loss clusters above/below key levels.
BOS/CHOCH (Break of Structure / Change of Character) signals a phase shift.
On 5m → fast moves for scalpers.
On 4H/Daily → swing trades with bigger follow-through.
Watch where retail piles in.
Institutions often take the opposite side.

After consolidating in 2023–2024, Bitcoin entered accumulation. In 2025, it surged above $124,000. Numerous retail traders purchased solely above $115,000, whereas institutions had already gathered below $20,000 or $30,000.
As of September 2025, USD/JPY trades near 148–149, showing signs of distribution after years of a strong dollar trend. Traders expecting endless USD strength may be entering too late.
Nvidia's explosive growth in AI chips created accumulation in 2022–2023, manipulation in 2024 with sharp dips, and distribution signs in late 2025 as valuations stretched.
Accumulation occurs when institutions purchase subtly following a decline. Manipulation happens when prices are sharply altered to mislead retail traders. Distribution occurs when institutions offload at elevated prices to the public.
They can last weeks, months, or even years. For example, gold prices consolidated in accumulation zones for years before major breakouts. Patience is key.
Use wider stop-losses, smaller positions, and confirm signals with volume and candlestick analysis instead of reacting to the first breakout.
Yes. The Wyckoff Method, developed over 100 years ago, remains a reliable framework for identifying accumulation, manipulation, and distribution phases.
In conclusion, accumulation, manipulation, and distribution are the heartbeat of financial markets. They explain why most retail traders lose and why institutions consistently profit.
In 2025, with technology, volatility, and institutional dominance at new heights, recognising these cycles is more important than ever. The choice is yours: be part of the crowd buying at the top, or learn the rhythm of accumulation and distribution to trade with confidence.
Disclaimer: This material is for general information purposes only and is not intended as (and should not be considered to be) financial, investment or other advice on which reliance should be placed. No opinion given in the material constitutes a recommendation by EBC or the author that any particular investment, security, transaction or investment strategy is suitable for any specific person.