Published on: 2025-09-03
Updated on: 2025-09-03

The Momentum Indicator can confirm trend strength when readings persist above zero in an uptrend or below zero in a downtrend, but it should sit alongside price and volume rather than act alone.
Used as a confirmation layer, it helps filter weak moves and supports better entries, holds, and exits in trending conditions.
The Momentum Indicator measures the speed of price change over a chosen lookback and is usually plotted around a zero line to show positive or negative momentum.
In simple form, Momentum = Momentum = Pₜ − Pₜ₋ₙ; sustained readings above zero with a rising slope in an uptrend, or below zero with a falling slope in a downtrend, confirm trend strength, but do not predict turns on their own.
Treat momentum as confirmation, then pair it with price structure and volume so that signals are timely and robust rather than late or noisy.
Confirmation helps separate strong trends from weak moves, which reduces false starts and improves confidence to hold winners while momentum persists.
It also supports disciplined exits by highlighting momentum flattening or loss of force, which can warn of fading trends before price reverses.
Positive momentum shows the price is higher than n periods ago, supporting a bullish bias when the line is rising and above zero.
Negative momentum shows price is lower than n periods ago, supporting a bearish bias when the line is falling and below zero.
Zero line crosses can hint at a bias shift, but use price and volume to validate any change.
Divergences, where price pushes to a new extreme but momentum does not, can warn of trend fatigue.
Lookback length: shorter settings react faster but add noise, longer settings smooth more but add lag, so tune per instrument and timeframe.
Slope and persistence: several rising or falling bars carry more weight than a single spike.
Zero line: sustained positive or negative readings support trend confirmation better than brief flips.
Multi-timeframe: align higher timeframe momentum with the trade timeframe to filter weak setups.
Volume confirmation: momentum thrusts with healthy volume are more reliable than those on thin activity.
In trends, use momentum to confirm breakouts or pullbacks so trades align with the forceful direction.
In ranges, frequent zero flips create whipsaws, so lean on range tools or oscillators instead.
On very short holds, extra confirmation time can compress reward to risk, so use momentum as a secondary check.
Setup: a stock rises from $48 to $52 over 10 days. With a 10‑period setting, momentum is 52 − 48 = +4, which supports a long bias while price holds firm.
Entry and risk: with a $10,000 account, buy 50 shares at $52 with a stop at $50, risking $100.
Management: hold while momentum remains positive and rising, then scale out near $54 to $55 if momentum stalls or rolls toward zero, signalling possible fatigue.

Rising price with increasing volume strengthens momentum confirmation and reduces the chance of failed breakouts.
Weak or falling volume on new highs or lows lowers reliability, so demand stronger evidence or stand aside.
Test lookbacks and rules out of sample to avoid curve‑fitting, and keep models simple so they generalise across regimes.
Avoid look‑ahead bias by ensuring all inputs are knowable at decision time, and verify robustness across instruments and timeframes.
Using momentum as a stand‑alone trigger
Fix: combine with price structure and volume, and treat momentum as confirmation.
Over‑shortening the lookback
Fix: reduce only as needed, then validate out of sample to control noise.
Ignoring the market regime
Fix: switch to range tools when momentum chops around zero and price is contained.
One setting for all markets
Fix: maintain instrument‑specific parameters and review them on a schedule.
Late exits after momentum peaks
Fix: use momentum flattening, a cross back through zero, or a divergence rule to scale out.
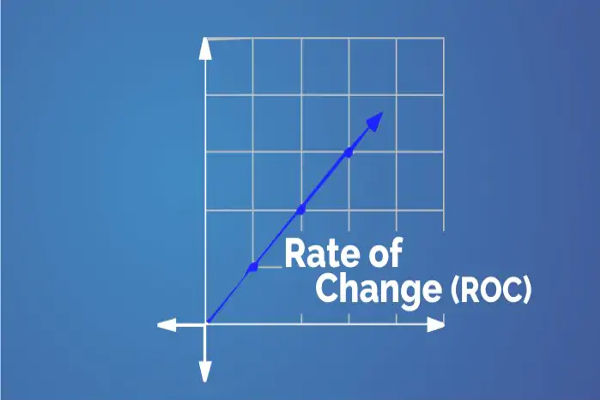
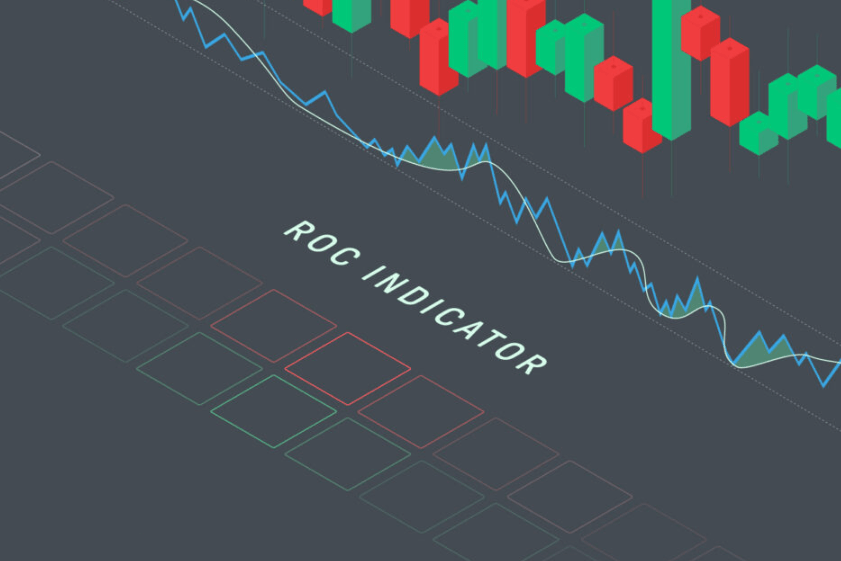
Rate of Change, ROC: a percentage version of momentum that scales change relative to prior price, often centred around 0 or 100.
Relative Strength Index, RSI: a bounded oscillator that compares average gains to losses to flag overbought or oversold conditions.
MACD: a momentum tool derived from moving averages that tracks shifts in trend and momentum.
Divergence: a mismatch between price and an indicator that can warn of weakening trend power.
A practical stack uses price structure for context, volume for participation, and momentum for confirmation, then adds a divergence rule for early warnings.
For entries, require structure plus volume alignment and a strong momentum reading, and for exits, watch for momentum flattening or cross‑backs so gains are protected without cutting trends too soon.

The Momentum Indicator can confirm trend strength by evidencing price acceleration in the prevailing direction, but it should sit alongside price and volume.
Used as a confirmation layer with tuned settings, regime awareness, and simple testing hygiene, it improves entries, holds, and exits while limiting late or false signals.


World's Best Broker