Published on: 2025-09-22
Updated on: 2025-11-06
Liquidity measures how quickly an asset can be bought or sold in the market without significantly affecting its price.
Liquidity refers to how easily an asset can be bought or sold in the market without causing a significant change in its price.
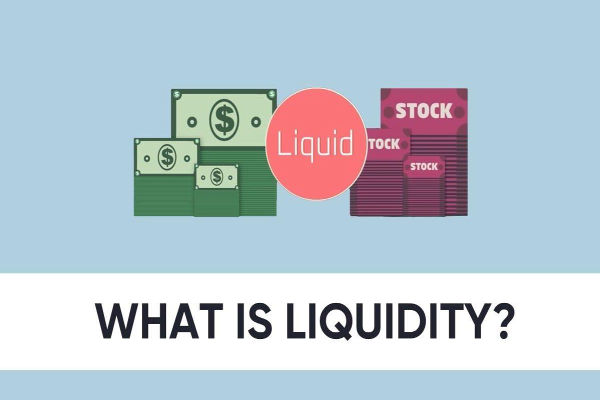
In simple terms, it measures how quickly you can convert something you own into cash. Highly liquid assets are those that can be traded swiftly at or near their market value.

Liquidity is the degree to which an asset or security can be quickly converted into cash with minimal loss of value.
High liquidity means there are many buyers and sellers, making transactions smooth and fast (e.g., major currency pairs or large-cap stocks).
Low liquidity means few participants and slower transactions, often leading to larger price swings (e.g., small-cap stocks or rare collectibles).
Liquidity can also refer to market liquidity (how easy it is to trade an asset) or account liquidity (how much cash or credit a trader has available).
Liquidity depends on market activity such as the number of active participants and the volume of trades. The more buyers and sellers in a market, the easier it is to match orders and maintain stable prices.
Here’s how liquidity works in practice:
A trader places an order to buy EUR/USD.
The broker’s system checks for available sellers in the interbank market.
Because EUR/USD is one of the most traded currency pairs, there are many counterparties.
The trade executes instantly at the quoted price, showing high liquidity.
In contrast, if a trader tries to sell a rare corporate bond, it may take longer to find a buyer, and they might need to accept a lower price, a sign of low liquidity.
High Liquidity: The foreign exchange (forex) market is the most liquid in the world, with over USD 7 trillion traded daily. Major pairs like EUR/USD or USD/JPY can be bought or sold instantly with tight spreads.
Low Liquidity: During the 2008 financial crisis, many mortgage-backed securities became illiquid and because there were no willing buyers, it forced sellers to take steep discounts.
Liquidity Provider: A financial institution or market participant that offers buy and sell quotes to maintain market liquidity.
Liquidity Risk: The danger of not being able to sell an asset quickly without a major price loss.
Market Depth: The volume of buy and sell orders at various prices, where a deeper market means higher liquidity.
Bid-Ask Spread: The difference between the buying (bid) and selling (ask) price, meaning that narrower spreads signal higher liquidity.
Liquidity ensures that trades can be executed quickly and at fair prices. Without it, traders risk slippage or being unable to exit positions efficiently.
Higher liquidity usually leads to tighter spreads and lower transaction costs, while low liquidity can cause wider spreads and slippage.
Yes. Liquidity often drops during off-market hours, holidays, or financial crises when fewer participants are active.
Liquidity measures how easily an asset can be traded without affecting its price. High liquidity provides smoother execution, tighter spreads, and more stable pricing, while low liquidity can lead to delays and volatility. It’s a key factor in assessing market efficiency, especially in forex and equity trading.
Disclaimer: This material is for general information purposes only and is not intended as financial, investment, or other advice. No opinion expressed here constitutes a recommendation that any particular strategy or investment is suitable for any individual.