Published on: 2026-07-01
Updated on: 2026-07-01
XLE vs USO is not a choice between two identical oil trades. It is a choice between owning energy-company cash flows and holding futures-linked crude exposure. It is important to be able to distinguish the differences because oil can rally for reasons that do not lift energy equities equally, and energy stocks can compound through dividends, buybacks, and valuation expansion even when crude itself stalls.

The current setup makes that difference visible. Front-month WTI crude traded near $69.49 on 1 July 2026 after a sharp one-month decline, while still holding a positive year-to-date return.
The futures curve remained mildly backwardated, with August 2026 crude above later-month contracts, a structure that can support futures-linked long exposure when rolls occur under favourable pricing.
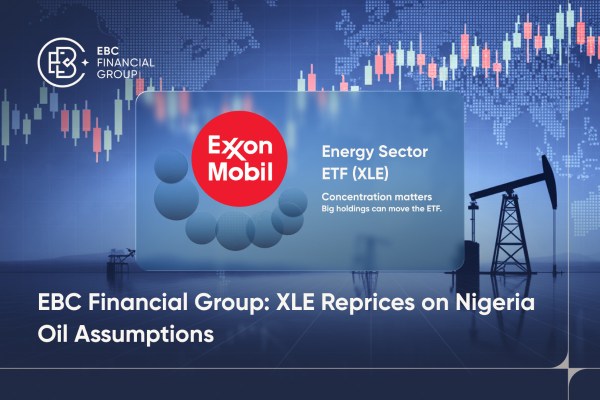
XLE is an equity-sector ETF, not a pure oil instrument. It tracks the Energy Select Sector Index and holds large US energy companies across oil, gas, consumable fuels, equipment, and services.
USO is a crude-futures product, not physical oil. Its NAV is designed to reflect daily changes in light sweet crude as measured by a benchmark WTI futures contract, plus collateral interest, less expenses.
Cost and income profiles diverge sharply. XLE carries a 0.08% expense ratio and a 2.83% fund distribution yield, while USO has no regular dividend profile and materially higher carrying costs.
USO has stronger short-term crude beta. It led XLE year to date and over one year, but it also carried roughly double XLE’s one-month volatility and more than twice its one-year volatility.
XLE has been the stronger long-horizon compounder. Over 10 years, XLE returned 8.80% annualised versus 1.22% for USO, with a higher trailing Sharpe ratio.
The correlation is moderate, not interchangeable. A trailing one-year correlation near 0.62 shows that both respond to oil, but their structures create meaningful divergence.

| Feature | XLE | USO |
|---|---|---|
| Main exposure | US energy-sector equities | WTI crude oil futures |
| Structure | Equity ETF | Futures-linked commodity pool |
| Core driver | Earnings, dividends, buybacks, oil prices, equity multiples | WTI futures prices, roll yield, collateral income, expenses |
| Benchmark | Energy Select Sector Index | Benchmark Oil Futures Contract |
| Expense ratio | 0.08% | Commonly shown around 0.86%, with current USCF data showing 0.70% |
| Income profile | Dividend-paying energy equities | No regular dividend stream |
| Best use | Medium-term sector allocation | Short-term crude-oil positioning |
| Main risk | Sector concentration and equity drawdowns | Futures roll, volatility, tracking divergence, tax complexity |
The cost line deserves precision. USO’s expense ratio appears differently across fund-data conventions: current USCF fund data showed a 0.70% total expense ratio on 29 June 2026, while major comparison profiles show 0.86%. The investment conclusion is unchanged. USO is materially more expensive to hold than XLE.
The oil thesis does not always have to start at the barrel. Traders weighing sector beta against futures-linked exposure can compare XLE and USO through EBC’s ETF CFD page, where the energy trade sits inside a broader universe of global ETF CFDs. Structure decides the risk before price decides the return.
XLE owns companies. USO owns exposure to contracts. That is the entire comparison.
XLE’s return comes from corporate economics. Oil prices affect revenue and cash flow, but shareholders also receive the effect of cost control, refining margins, production mix, balance-sheet leverage, dividend policy, and buybacks. State Street lists XLE with $35.72 billion in assets, 21 holdings, a 0.08% expense ratio, an 11.98x forward P/E, a 2.32x price/book ratio, and estimated three-to-five-year EPS growth of 8.81%.
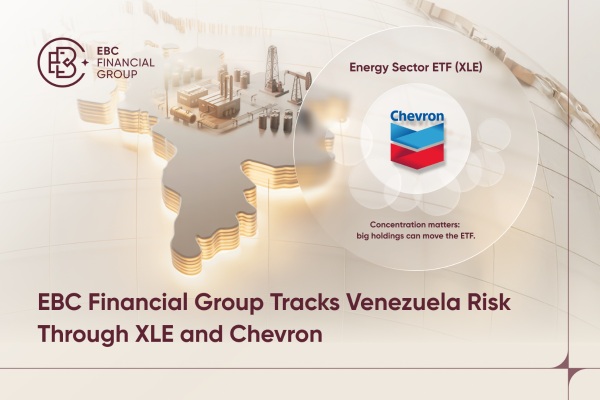
That equity wrapper creates both resilience and distortion. Exxon Mobil and Chevron account for close to two-fifths of XLE, while the top 10 holdings represent roughly three-quarters of assets.
This concentration gives XLE high exposure to integrated supermajors with strong balance sheets, but it also means the fund may lag a sudden crude spike if investors discount political risk, refining weakness, or slower earnings conversion.
USO is more direct, but not simpler. The fund seeks daily NAV changes that reflect daily changes in light sweet crude delivered to Cushing, Oklahoma, as measured by its benchmark futures contract. That benchmark normally sits in the near-month NYMEX contract and rolls into the next month over a five-day window at the start of each month. USO may also use swaps, forwards, cash, cash equivalents, and US government obligations.
The issuer’s own language is important: an investment in USO should not be viewed as an investment in light sweet crude oil itself or in the benchmark futures contract. It is a tradable structure designed to approximate daily futures-linked exposure, not a warehouse receipt for physical oil.
| Metric | XLE | USO | Reading |
|---|---|---|---|
| YTD return | 20.43% | 53.90% | USO led during the recent crude-driven cycle |
| 1-year return | 29.15% | 45.59% | USO captured stronger short-term oil beta |
| 3-year annualised return | 12.94% | 18.76% | USO benefited from the current futures cycle |
| 5-year annualised return | 18.38% | 16.03% | XLE regained the edge through equity compounding |
| 10-year annualised return | 8.80% | 1.22% | XLE delivered stronger long-horizon returns |
| 1-month volatility | 6.71% | 12.84% | USO moved almost twice as sharply |
| 1-year volatility | 20.78% | 43.83% | USO carried a much wider return range |
| Maximum drawdown | -71.26% | -98.19% | USO’s historical path was far more severe |
| Sharpe ratio | 1.41 | 1.05 | XLE delivered stronger risk-adjusted performance |
Recent performance explains why the title matters. USO can win decisively when the trade is a short, directional bet on WTI. XLE can win over longer horizons because energy companies retain cash flow, pay dividends, reduce share counts, and survive crude cycles with balance sheets intact. The two instruments answer different questions.
XLE tends to work best when the thesis is not simply “oil will rise tomorrow,” but “the energy sector will generate attractive cash flow over the next several quarters.”
That usually requires three conditions. Oil prices should be firm enough to protect upstream profitability. Refining and midstream conditions should not collapse. Equity markets should reward free cash flow rather than punish cyclicality.
This makes XLE more suitable for investors seeking energy participation with an income component and lower structural complexity. Its 2.83% distribution yield gives it a return source USO does not replicate, while the 0.08% expense ratio keeps holding costs low.
The trade-off is equity risk. XLE can fall even when crude is stable if the S&P 500 sells off, if earnings expectations reset lower, or if the market discounts weaker capital discipline. It is also not a broad energy basket in the intuitive sense. It is a concentrated large-cap US energy-equity vehicle dominated by a small number of companies.
USO tends to work best when the thesis is specific, near-term, and crude-centred. Inventory surprises, OPEC+ policy, hurricane disruptions, refinery outages, geopolitical shocks, and Cushing storage dynamics are the types of catalysts that can move WTI quickly.
Its structural advantage is precision. If the view is that WTI should rise over days or weeks, USO usually expresses that view more directly than an equity ETF whose holdings must still translate crude prices into earnings.
The risk is roll mechanics. When the WTI curve is backwardated, a long futures product may benefit from selling a higher-priced expiring contract and buying a cheaper later contract.
When the curve is in contango, the opposite occurs, and repeated rolls can drain returns. On 1 July 2026, August WTI traded above September and December contracts, showing mild backwardation across the front of the curve.
USO also brings complexity that equity ETFs do not. USCF lists USO among the products that issue K-1 tax forms, and the fund is structured as a commodity pool rather than a conventional investment company ETF. That makes it more specialised than its ticker simplicity suggests.
| Market view | Better fit | Why |
|---|---|---|
| WTI will move sharply over days or weeks | USO | More direct exposure to front-month crude futures |
| Energy companies will benefit from sustained oil strength | XLE | Captures earnings, dividends, buybacks, and valuation upside |
| Need income while holding energy exposure | XLE | Dividend-paying equities support total return |
| Concerned about futures roll and tax reporting | XLE | Avoids commodity-pool structure and monthly crude rolls |
| Seeking tactical exposure to inventory or OPEC shocks | USO | Better tied to crude-specific catalysts |
| Seeking lower cost and lower historical volatility | XLE | Lower expense ratio and smoother risk profile |
The cleanest difference is time horizon. USO is a tactical crude instrument. XLE is a sector allocation instrument. A bullish oil view can justify either, but only after the source of expected return is identified.
No. XLE owns energy companies, not crude oil. Its performance reflects oil prices, but also earnings, dividends, buybacks, refining margins, balance sheets, and equity-market risk. It is better understood as exposure to the business of energy rather than the commodity itself.
Often over short windows, but not always. USO is more directly tied to WTI futures, so it can respond faster when crude rallies. The final return also depends on roll yield, expenses, collateral income, and tracking behaviour.
Yes. XLE can fall if energy equities sell off even while crude rises. USO can weaken if crude futures decline or if roll conditions turn unfavourable, even when energy companies remain profitable. Their moderate correlation confirms that one cannot reliably replace the other.
XLE has the stronger case for longer holding periods because it owns cash-generating companies, carries lower fees, and pays distributions. USO is structurally more exposed to futures-market path dependency, which makes it less suitable as a passive long-term energy holding.
The main hidden risk is that the crude call can be directionally correct while the fund return still differs from spot oil because of futures rolls, tracking variance, expenses, and curve shape. USO is close to crude exposure, but it is not crude itself.
XLE and USO trade the same macro theme through different financial engines. XLE turns oil into equity cash flow. USO turns WTI futures into daily NAV exposure. That single structural difference explains their performance gaps, volatility gap, income gap, and holding-period gap.
For medium-term energy participation, XLE is usually the cleaner vehicle because it combines low cost, scale, income, and corporate cash-flow exposure. For a short-term WTI view with a defined catalyst and exit, USO is the sharper instrument. The better choice is not the one with the stronger oil narrative. It is the one whose structure matches the risk intended to be owned.
When the trade is crude itself, the cleanest signal is the oil tape. Traders tracking inventory shocks, OPEC headlines, or front-curve momentum can follow it through EBC’s commodities platform, where position sizing matters as much as direction when volatility expands.