Published on: 2025-07-16
Updated on: 2025-07-16
The Vanguard Energy ETF (VDE) is one of the most widely used exchange-traded funds for gaining broad exposure to the U.S. energy sector. While it often appears in long-term portfolio strategies, short- to medium-term traders are increasingly looking to VDE as a proxy for oil price sentiment, energy sector momentum, and macro-driven rotational plays.
With oil price volatility remaining high and geopolitical tensions shaping supply-side narratives, energy ETFs like VDE offer efficient exposure, strong correlation to crude, and technical clarity that suits active trading strategies.
 Launched by Vanguard, VDE tracks the MSCI US Investable Market Energy 25/50 Index, a cap-weighted benchmark capturing the performance of publicly traded U.S. energy companies, from integrated oil giants to smaller service providers.
For traders, the diversity of holdings means exposure is not overly concentrated in a single name, unlike XLE (which leans more heavily on ExxonMobil and Chevron). VDE currently includes over 100 stocks, creating a slightly smoother correlation to sector-wide movements than more top-heavy ETFs.
Its correlation with front-month crude oil futures (CL=F) and U.S. oilfield service stocks makes VDE an efficient trading vehicle for those tracking energy sentiment through macro or commodity-based lenses.
Key stats:
Benchmark: MSCI US IMI Energy 25/50 Index
Number of holdings: ~108
Top names: ExxonMobil (~22.4%), Chevron (~13.2%), ConocoPhillips (~6.7%)
Although traders tend to focus more on liquidity and spread than long-term fees, VDE's expense ratio of 0.10% remains noteworthy. It's in line with SPDR's XLE and just above Fidelity's FENY (0.08%).
| ETF | Expense Ratio | Average Holdings | Focus |
| VDE | 0.10% | ~100 | Broader U.S. energy |
| XLE | 0.10% | ~26 | Large-cap heavy (XOM/CVX) |
| FENY | 0.08% | ~100 | Cheaper, similar scope |
| IXC | 0.39% | Global | International exposure |
From a trader's standpoint, low fees mean tighter tracking to net asset value (NAV) and less drag on short-duration positions.
 As of July 2025. VDE manages roughly $7.3 billion USD in AUM. While this is smaller than XLE (~$40+ billion), it's still substantial enough to support tight spreads and deep order books.
Average daily trading volume: ~700.000 shares
Typical bid-ask spread: ~0.02–0.05% (depending on volatility and session volume)
For intraday or swing traders, this is sufficient to scale in and out without significant slippage. However, spreads may widen outside U.S. trading hours or during oil inventory reports (EIA, API) and OPEC press releases.
Pro Tip: When trading VDE around high-impact events (e.g., FOMC meetings, CPI data, OPEC+ announcements), consider setting limit orders to manage execution more precisely.
While dividends are not a primary driver for short-term traders, VDE's annual yield of 3.1%–3.3% can add an extra layer of return, especially for swing traders holding positions over several weeks.
Dividend details:
Frequency: Quarterly
Recent payout: ~$0.96 per share
Ex-dividend dates can create price gaps—important for technical setups
For options traders, ex-div dates may influence call/put pricing due to anticipated payouts. Be aware of this when structuring covered calls or credit spreads around VDE.
VDE is best suited for:
Macro Traders
Use VDE to play shifts in oil prices driven by geopolitical events, economic data, or OPEC moves. Its high correlation with crude makes it a proxy for those avoiding direct futures exposure.
Sector Rotation Traders
When energy outperforms the broader market (e.g., during inflationary cycles or commodity rallies), VDE offers clean exposure without idiosyncratic single-stock risk.
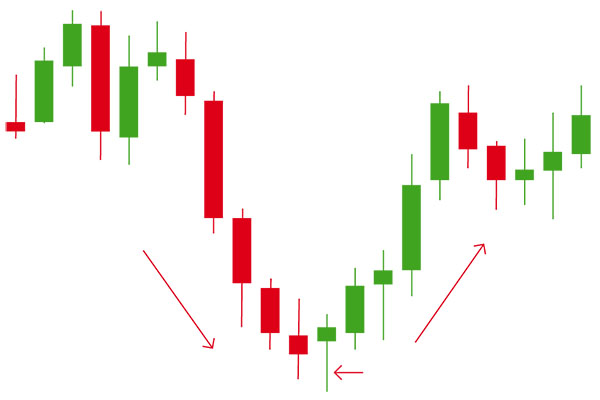
Technical Traders
VDE tends to respect key technical levels, making it a strong candidate for breakout/breakdown setups or trend continuation trades. Popular indicators include:
50-day and 200-day moving averages
RSI/MACD divergence near swing highs or lows
Fibonacci retracements after oil inventory surprises
Options Traders
VDE's growing options chain supports short-term strategies like:
Weekly credit spreads
Earnings-season hedges tied to oil majors
Long calls for bullish momentum setups
Arbitrage & Pair Traders
Compare VDE against XLE or FENY for pair trades based on short-term divergence in price action or relative strength.
VDE has evolved from a long-term investment tool into a viable, active trading instrument, especially in today's commodity-sensitive environment. With solid liquidity, sector breadth, and reliable tracking of U.S. energy equities, VDE offers traders a low-friction way to engage with macro trends, oil volatility, and sector momentum.
Whether you're trading the news around OPEC+, playing a breakout in crude, or rotating into energy from lagging tech or financials, VDE stands out as a clean, scalable ETF built for tactical execution.
Just remember: while VDE offers efficient exposure, its underlying names are still tied to the cyclical, high-volatility nature of the oil market. Use proper risk controls, watch correlations, and don't underestimate how quickly energy sentiment can shift.
Disclaimer: This material is for general information purposes only and is not intended as (and should not be considered to be) financial, investment or other advice on which reliance should be placed. No opinion given in the material constitutes a recommendation by EBC or the author that any particular investment, security, transaction or investment strategy is suitable for any specific person.


World's Best Broker