Why Is SMCI Stock Dropping? Are SMCI Earnings at Risk?
Super Micro Computer (SMCI) is still one of the key listed names in the AI server space, but its share price has taken a heavy hit in recent months.
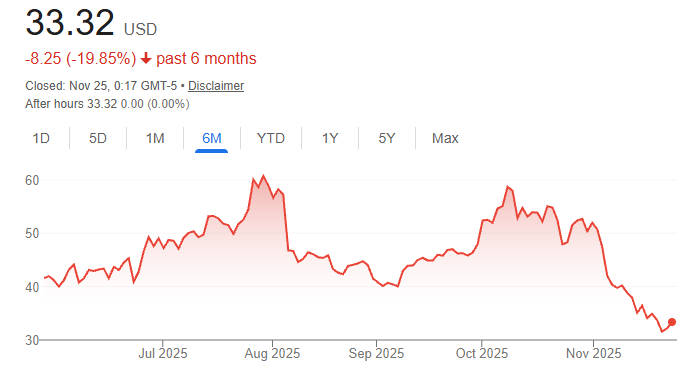
As of the latest close on Monday 24 November 2025. SMCI finished around 33.32 USD, up 3.51% on the day but still almost 50% below its 52-week high of 66.44 USD, with a 52-week range of 25.71 to 66.44 USD.
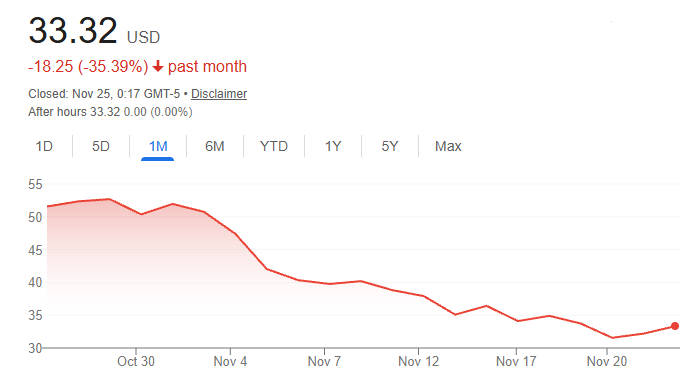
Over the last ten trading days the stock is down about 17%, even after a short bounce, reflecting how sharply sentiment has shifted since the latest earnings miss.
At the centre of that move is one question: can SMCI turn huge AI demand into consistent, growing earnings, or will execution and margin pressure keep holding the stock back?
Current snapshot: SMCI after the recent drop
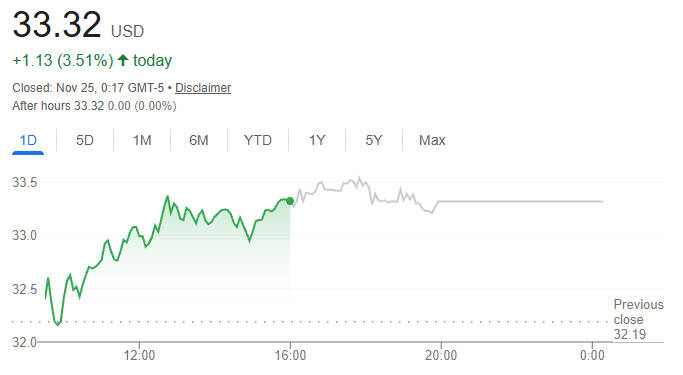
A few key numbers frame where SMCI stands today:
Last close: 33.32 USD
Day range: roughly 32.0 to 33.5 USD
52-week range: 25.71 to 66.44 USD
Distance from 52-week high: about 50% below the peak
Daily volume: around 27–28 million shares, slightly below the 50-day average near 30–31 million
On a 12-month view, the stock is roughly flat to modestly lower, despite a huge round-trip from the highs. One data provider shows a 1-year change of around −3%, underlining how much of the AI run-up has been given back.
Short-term technical services note that:
The price has fallen in six of the last ten sessions and is down more than 17% over that span, even with the latest rebound.
Several technical dashboards classify SMCI as "Sell" or "Strong Sell" on a daily basis, based on moving averages and oscillators.
So even though Monday's session was positive, the bigger picture is still a stock under pressure after a tough earnings season.
What the latest SMCI earnings really show

Q1 FY2026: headline miss and margin squeeze
SMCI's most recent earnings release was Q1 fiscal 2026. reported on 4 November 2025 for the quarter ended 30 September 2025.[1]
Across several credible sources, the story is consistent:
Well below analyst expectations around 6.0–6.1 billion USD
Down from 5.94 billion USD in the same quarter a year earlier
GAAP diluted EPS: 0.26 USD, below estimates around 0.29–0.30 USD
Non-GAAP EPS: about 0.35 USD, missing consensus in the 0.41–0.46 USD range
Gross margin: roughly 9.3%, down from about 13.1% a year earlier
Operating cash flow: about 918 million USD of cash outflow, reflecting working-capital swings and heavy investment.
Management explained that roughly 1.5 billion USD of revenue was pushed from Q1 into Q2 after large AI customers requested last-minute configuration upgrades to complex GPU rack systems.
That timing issue helps explain why the top line fell short, but it does not fully ease investor concerns:
Margins are now well into single digits despite strong AI demand.
Net income dropped sharply year on year (168 million vs 424 million USD).
Several analysts trimmed forecasts and price targets after the print.
Guidance: strong growth promises, but credibility questions
At the same time, SMCI raised its longer-term outlook:
Revenue: 10–11 billion USD, well above prior Street estimates around 7.8 billion USD
GAAP EPS: 0.37–0.45 USD
Non-GAAP EPS: 0.46–0.54 USD
The market reaction shows that investors are no longer taking these targets at face value:
In October, SMCI cut its Q1 revenue outlook from 6–7 billion USD to about 5 billion USD, citing order delays. The stock dropped about 7–8% on that news alone.
The actual Q1 print then came in at the low end of that reduced guidance and still missed consensus.
MarketWatch and other outlets have highlighted a "credibility gap" between management's ambitious revenue goals and what the Street is willing to believe after repeated guidance resets and delayed filings in the past.
In a word, the earnings miss hurt, but the trust issue may be hurting even more.
Are SMCI earnings at risk from here?
SMCI is still tied to one of the strongest themes in markets: AI compute and data-centre infrastructure. But the recent quarter and the guidance saga show several real risks to earnings over the next 12–24 months.
1. Execution and timing risk
Complex AI racks with high-end GPUs are hard to build, integrate and ship. Management openly acknowledged that configuration changes and testing caused delays that pushed about 1.5 billion USD of revenue into Q2.
When revenue shifts between quarters, reported earnings become "lumpy", which makes it harder for traders and long-only funds to model results and stay confident in guidance.
2. Margin risk
Gross margins have fallen from over 13% to about 9.3% as SMCI races to win large AI deals, invest in capacity and absorb tariffs and higher costs.
Wedbush, for example, has warned that margins could fall another 300 basis points sequentially, and cut its FY2026 EPS forecast from 2.87 USD to 2.16 USD, and FY2027 from 3.76 USD to 3.28 USD, even while assuming nearly 70% revenue growth.
That kind of profile, with rapid sales growth alongside declining margins, is precisely what creates a sense of fragile earnings.
3. Valuation and AI sentiment
Based on recent data, SMCI trades at about 27 times trailing 12-month earnings, above its own 12-month average P/E near 24.
At a market value somewhere around 19–20 billion USD, the company is not cheap if earnings stay under pressure.
Broader market commentary shows growing concern about stretched AI valuations, which has contributed to sharp swings in stocks like SMCI around earnings and guidance headlines.
4. Governance and reporting overhang
Put together, SMCI earnings are not collapsing, but they are clearly at risk in the near term. To win back trust, the company will need several clean quarters where:
Revenue lands close to guidance
Margins start to stabilise or improve
Cash flow turns more positive and predictable
SMCI earnings date: what traders need to know

Q1 FY2026 results were released on 4 November 2025. followed by a conference call on the same day.
The company has not yet posted an official Q2 FY2026 earnings date on its investor-relations site.
Independent earnings calendars currently cluster in early February 2026. but show different estimates:
TipRanks and Investing.com list 2–3 February 2026
Wall Street Horizon shows 9 February 2026 after market as an unconfirmed date
Zacks points to 24 February 2026
Because these are third-party estimates, traders should treat the February timing as a window, and check the official IR page closer to the event for a confirmed date.
Technical picture: RSI, CDMA-style trend signals & key levels
Different platforms calculate indicators slightly differently, but the broad technical message for SMCI is similar: downtrend still in place, with some signs of short-term stabilisation after heavy selling.
Here is a consolidated snapshot using data from Investing.com, TipRanks, Financhill, Barchart and other technical sources as of the 24 November 2025 close:
| Indicator / Level |
Latest reading (approx.) |
Interpretation (daily timeframe) |
| Last close |
33.32 USD |
Small bounce, but still far below this year's highs. |
| 52-week range |
25.71 – 66.44 USD |
Trades near the lower half of the yearly range; still about 50% under the peak. |
| 10-day performance |
≈ −17.1% |
Confirms a sharp short-term downswing despite the latest rebound. |
| Volume vs 50-day avg |
27.7M vs 30.7M shares |
Activity remains high, but slightly below recent average, suggesting selling pressure is easing a bit. |
| RSI (14-day) |
~52 (Investing.com) |
Neutral zone; selling has cooled after earlier oversold readings, but no clear bullish momentum yet. |
| MACD (12,26,9) |
~−0.21 (Investing.com) |
Slightly negative; trend bias still points lower, but the signal is not extreme. |
| 5-day moving average (SMA) |
~33.2 USD |
Price is roughly in line with the very short-term average, hinting at near-term consolidation. |
| 20-day moving average (SMA/EMA) |
≈ 40–41 USD |
Price sits far below the 20-day trend line, a classic short-term downtrend signal. |
| 50-day simple moving average |
~47.0 USD |
Medium-term trend remains clearly bearish while price stays well under this level. |
| 200-day moving average |
~44.5 USD |
Long-term trend line also above current price; longer-term investors still see a broken prior uptrend. |
| Bollinger Bands (20-day) |
Signal: Sell (Barchart) |
Bands show price leaning toward the lower side of its recent volatility range, with the Bollinger strategy still flashing "Sell". |
| Average True Range (14–20 day) |
ATR ≈ 2.6 USD (~8% of price) |
Very high daily volatility; swings of 7–8% in either direction are common. |
| ADX (14-day) |
ADX ≈ 13, +DI 24 / −DI 31 |
Directional index still tilted to the downside; trend strength is moderate but selling bias persists. |
| CDMA-style trend (price vs MAs & ADX) |
Direction: Bearish (composite) |
There is no single standard "CDMA" indicator, but a composite view of directional moving averages and ADX points to a downtrend. |
Key levels traders are watching
Near-term support:
Recent lows in the low-30s and high-20s form a support band. Some technical services highlight the upper 20s as a deeper risk area if selling restarts.
First resistance:
The mid-30s, then the 40–42 USD zone around the 20-day moving average.
Stronger resistance:
Around 47 USD, where the 50-day average currently sits, marking the line between a short-term bounce and a real trend change.
For now, the path of least resistance still tilts lower, but daily indicators show less panic than during the initial post-earnings sell-off.

SMCI has turned into a high-beta AI infrastructure trade, not a quiet tech holding. On many days it moves several times the broader market, and earnings headlines can add sudden gaps.
With EBC Financial Group, you can express a view on SMCI by trading it as a CFD alongside major indices and other US equities:
Go long or short to position around earnings or guidance updates
Use flexible position sizes to control exposure on a volatile name
Apply stop-loss and take-profit orders to manage risk around big intraday swings
Given the combination of earnings uncertainty and heavy technical pressure, position sizing and risk control matter more here than trying to nail an exact bottom or top.
All trading involves risk. Past moves in SMCI or the AI sector do not guarantee future performance.
FAQs: SMCI stock dropping & SMCI earnings
Why is SMCI stock dropping?
SMCI has fallen mainly because its latest quarter missed on both revenue and earnings, margins dropped to about 9.3%, and the company has repeatedly adjusted guidance in short order. At the same time, markets have become more cautious on high-multiple AI names, so any earnings disappointment hits the share price harder.
Are SMCI earnings at risk?
Yes, near-term SMCI earnings are clearly at risk:
Revenue timing can swing by billions of dollars between quarters
Margins are under pressure from big AI deals and rising costs
Analysts have cut FY2026 and FY2027 EPS estimates despite strong revenue growth assumptions
The long-term AI story is still there, but the market now wants proof that SMCI can grow and protect margins at the same time.
What is the next SMCI earnings date?
The last SMCI earnings release was 4 November 2025 (Q1 FY2026). Several independent calendars currently place the next earnings release in early February 2026. around 2–3 February, with some showing dates as late as 9 or 24 February. These are estimates only and have not yet been confirmed by the company.
Is SMCI stock cheap after this drop?
Even after the pullback, SMCI trades at roughly 27 times trailing earnings, above its recent average P/E. That may be reasonable if the company hits its 36-billion-dollar revenue goal and improves margins, but it leaves little room for more disappointments.
What does the RSI say about SMCI right now?
SMCI's 14-day RSI is around 52. which is neutral. That suggests the stock is no longer deeply oversold, but it has not yet built strong upward momentum either.
Conclusion
SMCI is now a story about execution and trust. The company sits at the heart of the AI server boom, but the market is waiting for stable earnings, cleaner guidance, and better margins before it is willing to pay the kind of premium multiples seen earlier in the cycle.
Until then, traders in SMCI need to stay nimble, respect the volatility, and anchor decisions in both the earnings data and the technical signals on the screen.
Sources:
[1] https://ir.supermicro.com/financials/quarterly-results/default.aspx
Disclaimer: This material is for general information purposes only and is not intended as (and should not be considered to be) financial, investment or other advice on which reliance should be placed. No opinion given in the material constitutes a recommendation by EBC or the author that any particular investment, security, transaction or investment strategy is suitable for any specific person.
