Published on: 2026-07-20
Updated on: 2026-07-20
A higher uranium price does not guarantee a higher Global X Uranium ETF price. URA closed near $38.73 on 17 July 2026, down about 9% from its 31 December 2025 level, even though spot uranium was modestly above its December mark and the long-term contract price had reached a multi-year high. The commodity firmed while the fund fell, and that gap is the first thing to understand before reading one as a proxy for the other.
URA owns miners, mine developers, physical uranium vehicles and nuclear-industry companies. Their share prices respond to contracts, costs, financing, project progress and stock-market sentiment, not only to spot uranium.
URA tracks nuclear-related securities rather than the uranium spot price.
In 2026, URA fell while spot uranium held broadly firm and the long-term price reached a multi-year high.
Producer revenue follows contract terms and delivery schedules, so higher prices can take years to reach earnings.
Cameco’s 23% weighting can outweigh a moderate move in uranium.
Rates, financing, dilution, costs and execution can weaken the link between URA and the commodity.
As of 17 July, URA held 56 positions and roughly $5.4 billion in net assets. Cameco represented about 23% of the portfolio, while the ten largest holdings made up close to 64%.
| URA Snapshot | Reading |
|---|---|
| Net assets, approximately | $5.4 billion |
| Expense ratio | 0.69% |
| Holdings | 56 |
| Top-ten concentration | 63.96% |
| Cameco weighting | 23.03% |
| Reported portfolio P/E | 33.68 |
| YTD price return | About -9% |
| Data date | 17 July 2026 |
Uranium does not trade on a large central exchange like crude oil or copper. Buyers and sellers negotiate privately, while specialist services publish spot and long-term indicators. Most utility fuel is secured through long-term contracts rather than bought on the smaller spot market.
URA follows companies involved in uranium mining, exploration, nuclear components and related activities. Producing miners depend on realised prices, output and costs. Mine developers depend on permits, financing and project economics.
Physical uranium vehicles respond more directly to uranium prices, although they can trade above or below the value of their holdings. Reactor companies depend on licensing and customers, while engineering suppliers depend on orders and margins.
These holdings do not react at the same speed. A producer carries operating risk, a developer carries financing and construction risk, and a reactor company may move while uranium barely changes.
URA therefore combines several nuclear trades into one fund. It may behave like a more volatile equity version of the uranium theme, but it does not mirror the metal.
Most uranium reaches utilities through contracts lasting several years. Prices may be fixed, rise gradually or be linked to future market indicators. Producer revenue follows those agreements rather than the daily spot quote, and deliveries under a new contract may not begin for two years or more.
Cameco’s price-sensitivity table, based on commitments in place on 31 March 2026, shows the delay. An $80-per-pound spot assumption produced an estimated 2026 realised price of $66. Raising spot to $120 increased the estimate to only $69, because deliveries are locked to volumes already committed under older terms. A sudden spot increase may therefore have little effect on current-year revenue.
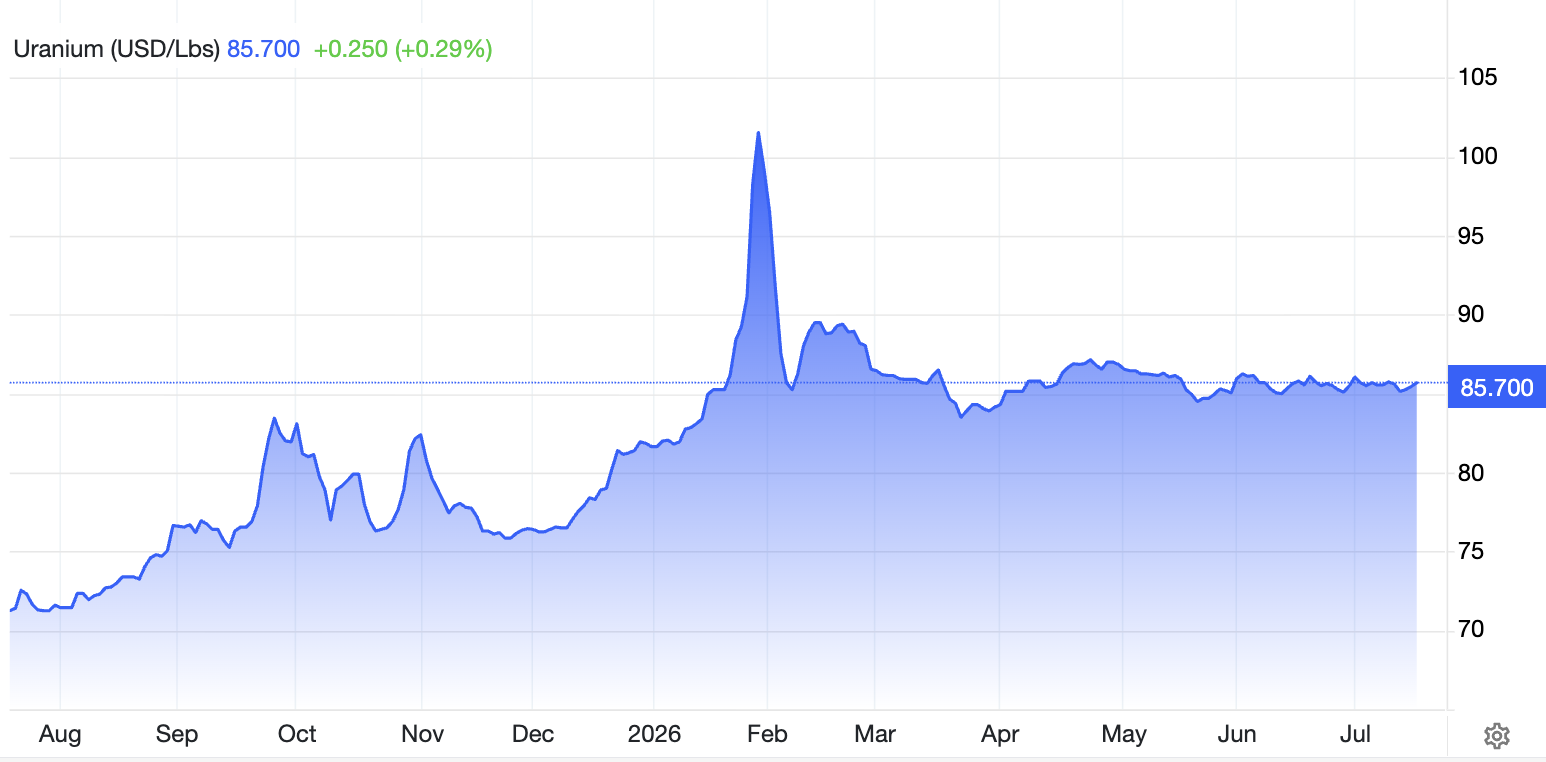
The 2026 market shows the difference. Spot uranium was around $81 per pound at the end of December 2025, while the long-term indicator stood near $86. The long-term price then climbed to a multi-year high while spot stayed within a range.
Uranium equities often respond more strongly to long-term prices, yet URA still traded below its year-end level because company results, financing conditions and wider market risk also mattered.
The timing depends on each company’s contract terms, delivery schedule, pricing formulas and uncommitted production. One producer delivering under older, cheaper contracts may see little near-term benefit from a rally, while another with market-linked pricing responds faster. That delay is one of the main reasons URA and spot uranium can move in different directions.
Cameco accounted for 23.03% of URA on 17 July. NexGen Energy was next at 6.30%, followed by Oklo at 5.91%, the Sprott Physical Uranium Trust at 5.41% and Kazatomprom at 5.23%. A fund with almost one-quarter of its assets in one company cannot be judged through uranium prices alone.
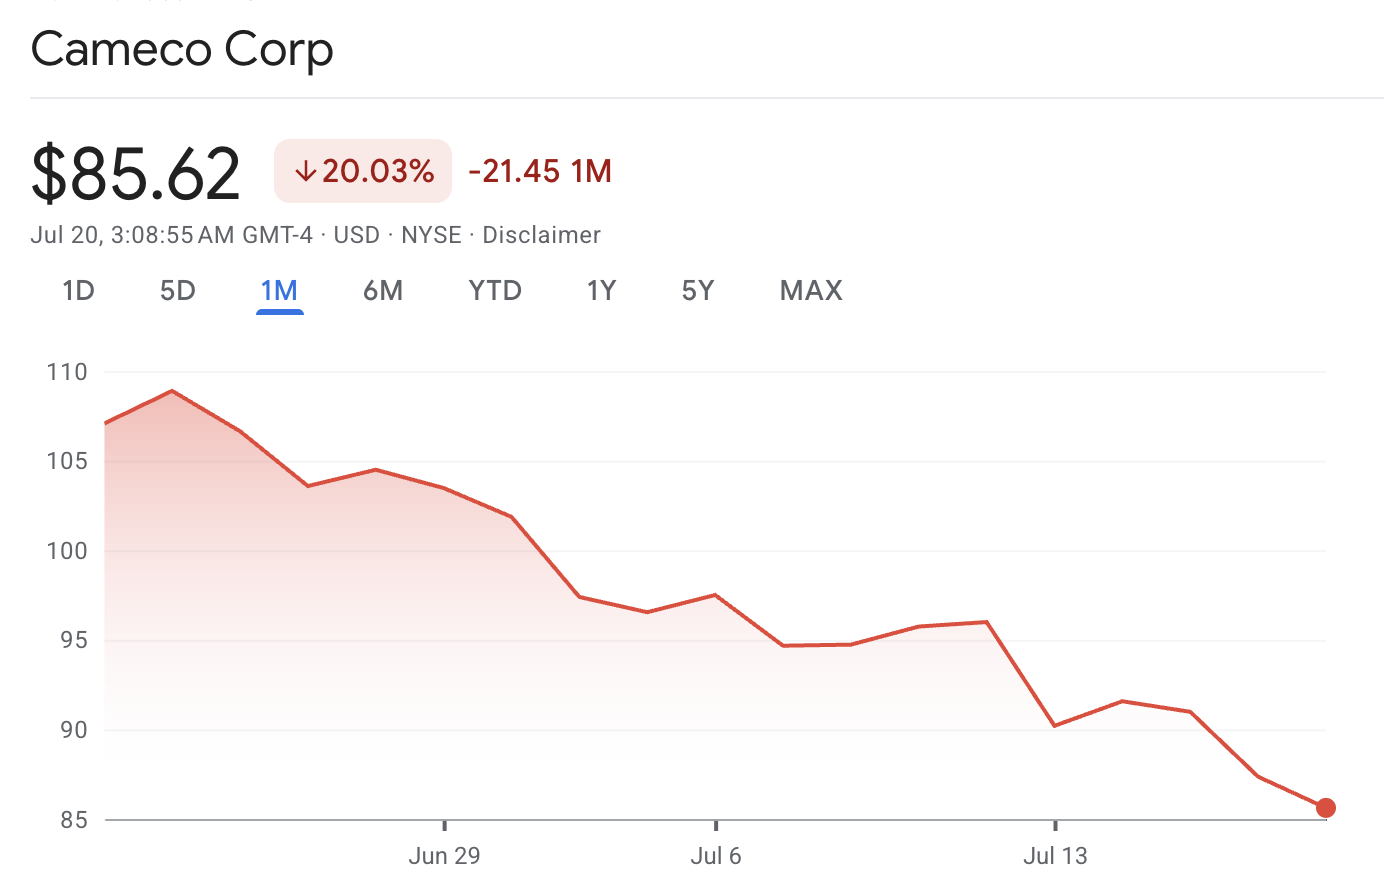
Cameco moves on production guidance, mine disruptions, selling prices, costs, earnings and Westinghouse performance. None of these requires a matching move in spot uranium. A 5% decline in a holding with a 23% fund weight removes roughly 1.15 percentage points from URA before other holdings move, and a modest uranium gain may not offset that drag.
The same concentration can work in reverse when stronger guidance lifts URA while uranium is unchanged.
URA’s reported portfolio P/E of about 33.68 combines businesses at very different stages.
| Holding Type | More Useful Measures |
|---|---|
| Producing miner | Cash flow, realised prices and production costs |
| Mine developer | Project NAV, construction budget and financing |
| Explorer | Resource value and cash runway |
| Physical uranium vehicle | Premium or discount to NAV |
| Reactor developer | Cash runway, licensing and customer agreements |
| Component supplier | P/E, backlog and margins |
Producing miners generate revenue, while developers may have little or none. Physical vehicles are compared with the uranium they hold, and reactor developers depend on licensing, customers and available cash.
The headline P/E cannot separate businesses producing cash today from projects that still need funding, approval or construction. It is a broad statistic, not a complete answer to whether URA is cheap or expensive.
URA can weaken while uranium holds firm because the companies inside the fund face risks the metal does not. Higher interest rates reduce the value placed on distant profits and raise financing costs.
A mine developer may issue more shares to fund construction, reducing each existing shareholder’s ownership percentage, and a higher uranium price still does not remove the need to raise money, receive permits and build the mine.
Operating costs create another break. Labour, energy, materials and regulatory expenses may rise faster than realised prices, leaving revenue higher but margins weak. Currency and policy add further layers.
URA trades in US dollars while several holdings report in other currencies. Russia also supplies a large share of global uranium enrichment services, so sanctions and fuel-security measures can affect miners, enrichers and reactor companies differently.
Spot versus long-term pricing: Stronger long-term prices have a clearer link to future producer revenue than a brief spot rally.
Utility contracting volumes: Price strength is more meaningful when utilities commit to multiyear supply.
Cameco guidance and realised prices: Production targets, selling prices, costs and Westinghouse results can determine URA’s direction.
Developer milestones: Permits, financing, construction budgets and production dates matter because a higher uranium price does not build a mine.
Equity and financing conditions: Interest rates, smaller-company stocks and market sentiment affect holdings whose profits may be years away.
A useful sixth check is the premium or discount to net asset value on physical uranium vehicles. If physical exposure rises while miners fall, the gap is more likely coming from company costs, financing pressure or stock-market weakness than from lower uranium demand.
World Nuclear Association data updated on 17 July 2026 listed 440 operable reactors, 79 under construction and 120 planned. Estimated uranium requirements for 2025 were about 68,920 tonnes.
More reactors support long-term demand, but new capacity does not move directly into URA’s daily price. Utilities must secure fuel, developers must finance mines, and reactor companies must receive licences and sign customers. Strong long-term demand can therefore exist alongside a weak month or year for URA.
Not directly. It gains partial exposure through holdings such as the Sprott Physical Uranium Trust, while most of the portfolio consists of listed companies.
URA owns companies whose values depend on contracts, costs, financing, concentration and stock-market sentiment. Those forces can outweigh a moderate uranium move.
No, but a weighting above 23% gives Cameco enough influence to outweigh smaller holdings or a modest move in uranium.
It can be. The equities add operating, financing and market risk on top of commodity exposure.
Use cash flow and costs for producers, project value and funding needs for developers, net asset value for physical vehicles, and licensing or order milestones for nuclear-technology companies.
URA is linked to uranium through a chain of listed businesses rather than direct ownership of the metal.
Spot and long-term prices shape that chain, but contracts determine when producers benefit. Costs determine how much revenue becomes profit, while financing determines whether future mines and reactors are built.
When uranium rises and URA falls, check Cameco, long-term contract prices, producer costs, interest rates and developer funding before treating the difference as a market mistake. Uranium is a major part of URA’s value, but it is never the entire valuation model.