Published on: 2025-08-08
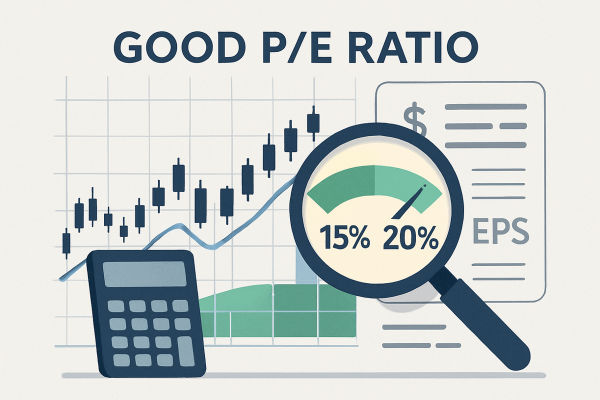
In most cases, a P/E ratio between 15 and 20 is considered healthy for established companies, as it reflects a balance between reasonable valuation and growth potential. However, what is considered "good" can vary significantly by industry, market conditions, and your investment strategy.
For context, the Price-to-Earnings ratio (P/E ratio) is commonly employed to help traders and investors assess whether a stock is undervalued, fairly valued, or overvalued. So, what is a good P/E ratio?
In this guide, we'll explain what the P/E ratio means, how to interpret it correctly, the rules every trader should know, and how to apply it to your trading decisions.

As mentioned above, the P/E ratio measures the relationship between a company's stock price and its earnings per share (EPS). It is calculated as:
P/E Ratio = Stock Price ÷ Earnings Per Share (EPS)
For example, if a company's stock is priced at $50 and its EPS is $5, the P/E ratio is 10.
To summarise, the P/E ratio gives insight into:
How much are investors willing to pay for each dollar of earnings?
Whether a stock is potentially overvalued or undervalued.
How the market perceives a company's future growth potential.
A high P/E ratio may indicate high growth expectations, while a low P/E ratio might signal undervaluation or financial difficulties.
1. Trailing P/E
Based on the past 12 months of earnings.
More dependable since it relies on actual outcomes rather than forecasts.
2. Forward P/E
Based on projected future earnings.
Useful for growth companies but relies on estimates.

Different sectors have different acceptable P/E ranges:
| Industry | Typical P/E Range |
|---|---|
| Technology | 20–40+ |
| Consumer Goods | 15–25 |
| Utilities | 10–20 |
| Financials | 12–20 |
| Energy | 8–15 |
Overall, there is no single "magic number" for a good P/E ratio, but here are some general guidelines:
Overall Market Average: Historically, the S&P 500's P/E ratio averages between 15 and 20.
Value Stocks: Typically under 15.
Growth Stocks: Often 20+, sometimes exceeding 50 for high-growth tech firms.
A "good" P/E ratio depends on industry norms, economic conditions, and the company's growth potential.
For example, during bull markets, P/E ratios tend to rise as investor optimism increases. During bear markets, P/E ratios often fall due to lower earnings expectations and reduced investor confidence.
Therefore, a "good" P/E ratio can vary with the general market mood.

High P/E Ratio
Signals investor optimism and high growth expectations.
Could indicate overvaluation if earnings growth does not materialise.
Low P/E Ratio
May signal undervaluation or that the stock is out of favour.
It could also reflect underlying business or industry challenges.
Case Study: Applying P/E Ratio Analysis
Imagine two companies in the retail sector:
Company A: P/E = 12, steady growth, strong balance sheet.
Company B: P/E = 25, rapid growth, but high debt.
A value investor may prefer Company A for its lower valuation, while a growth investor might choose Company B for its expansion potential.
Compare Within Industry: Always benchmark a stock's P/E against sector averages.
Combine with Technical Analysis: Use charts and price patterns to confirm timing.
Evaluate Over Time: Look at historical P/E trends for consistency.
Ignoring Industry Norms: Comparing a tech stock to a utility is misleading.
Relying on P/E Alone: It should be one of many tools used in analysis.
Not Considering Earnings Quality: One-off events may inflate earnings.
When discussing reliance solely on the P/E Ratio, employing the PEG ratio (Price/Earnings to Growth) can modify the P/E ratio to consider earnings growth.
PEG = P/E Ratio ÷ Annual EPS Growth Rate
PEG = 1: Fairly valued.
PEG
PEG > 1: Possibly overvalued.
| Advantages | Limitations |
|---|---|
| Simple to calculate and widely used | Doesn’t account for debt, cash flow, or growth rates |
| Helps compare stocks within the same sector | Can be distorted by temporary earnings changes |
| Reflects market sentiment towards a company | Not useful for companies with negative earnings |
| Useful starting point for deeper analysis | Industry averages vary widely |
1. What Is Considered a Good P/E Ratio for Stocks?
Answer: A P/E ratio between 15 and 20 is often seen as reasonable for established companies. However, "good" varies by industry as tech stocks may have higher P/E ratios due to growth potential, while utilities tend to have lower ones.
2. What Is a Good P/E Ratio for Long-Term Investing?
Answer: For long-term investors, a P/E ratio close to or slightly below the industry average is often attractive, as it suggests fair pricing with room for growth without overpaying.
3. Can a Low P/E Ratio Be a Good Sign?
Answer: A low P/E ratio can signal undervaluation, but it can also indicate weak growth prospects or financial trouble. It's vital to analyse other financial metrics before investing.
In conclusion, the P/E ratio serves as a significant yet straightforward method for assessing stock valuations, with its real importance lying in context.
A "good" P/E ratio is not just about the number; it's about understanding the company's industry, growth prospects, and market conditions.
Disclaimer: This material is for general information purposes only and is not intended as (and should not be considered to be) financial, investment or other advice on which reliance should be placed. No opinion given in the material constitutes a recommendation by EBC or the author that any particular investment, security, transaction or investment strategy is suitable for any specific person.