Published on: 2026-04-20
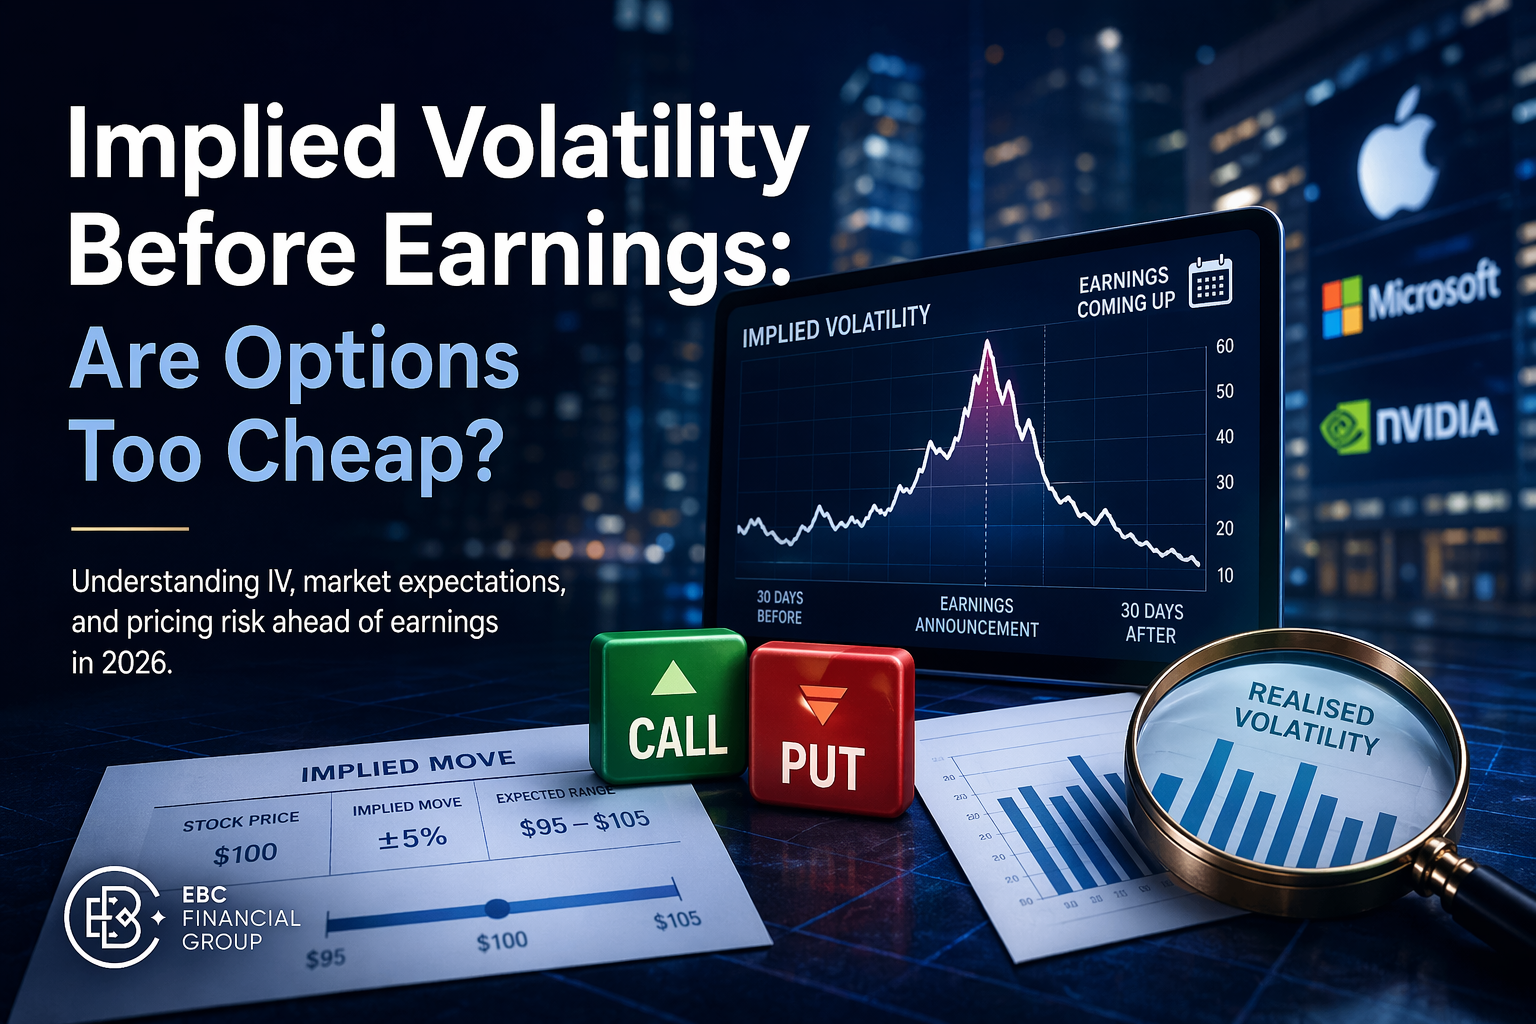
Implied correlation is the options market’s estimate of how strongly the stocks inside an index are expected to move together over a future period. It is not observed directly in the cash market. Instead, traders infer it from options prices, usually by comparing the index's implied volatility with the implied volatility of the stocks in the index.
In simple terms, implied correlation helps answer one question: are index constituents expected to move in sync, or are they expected to behave more independently? That matters because index risk depends not only on how volatile each stock is, but also on how much its moves overlap.

Implied correlation measures the market’s expected average co-movement among index constituents, based on options prices.
It is inferred from the relationship between index implied volatility and component implied volatility, not taken from historical price data.
A higher implied correlation usually indicates weaker diversification benefits within the index.
Traders watch it for dispersion trading, relative-value volatility trades, and broad equity hedging.
It should be used with realised correlation, implied volatility, liquidity, and event risk, not on its own. This is an editorial inference based on how exchange methodology and volatility education materials frame the concept.
For an index such as the S&P 500, implied correlation reflects how tightly the market expects the underlying stocks to move together over the option horizon. If traders expect many stocks to react in the same direction to macro news, implied correlation tends to rise. If they expect more stock-specific dispersion, implied correlation tends to fall.
This is why implied correlation is often described as a measure of future diversification benefits. Lower expected correlation means diversification is doing more work. A higher expected correlation means diversification is providing less protection because more names are expected to move together.
Implied correlation is derived from the relationship between index implied volatility and the implied volatility of the index's constituent stocks. The intuition comes from portfolio variance: an index’s variance depends on both the variance of each component and the covariance between components.
In other words, index risk is shaped by two forces: how volatile each stock is on its own, and how much those stocks are expected to move together. Cboe describes its implied-correlation index as quantifying the spread between the SPX's implied volatility and the average implied volatility of a single-stock basket, using implied volatilities for the index and its components.
In practice, traders start with observed options-implied volatilities, convert them into implied variances, and then solve for the average correlation that makes the index variance consistent with the component variances.
Cboe’s methodology notes that the correlation index is calculated by first finding the difference between SPX option implied variance and the implied variance of an uncorrelated basket portfolio, then dividing that difference by the sum of pairwise weighted implied-volatility products.
A practical way to express the idea is to start with the portfolio-variance relationship under an average-correlation assumption:

Where:
σ(I) = implied volatility of the index
w(i) = weight of stock ii in the index or tracking basket
σ(i) = implied volatility of stock ii
ρ = average implied pairwise correlation
n = number of component stocks
This formula shows where correlation enters the index-variance calculation: through the covariance terms between stocks. Cboe’s white paper follows the same logic, starting from the Markowitz portfolio model, replacing pairwise correlations with an average correlation term, and then isolating that average correlation.
Rearranging the expression gives the implied-correlation estimate:

This is the safer formula to publish because it does not assume equal stock weights or identical single-stock volatility. Exact live benchmarks can still apply additional methodology rules around basket construction, maturities, and volatility inputs.
Implied correlation matters because index options do not depend only on average single-stock volatility. They also depend on how much those stocks are expected to move together. Holding component volatility constant, higher expected co-movement tends to lift index variance and reduce the diversification benefit inside the basket.
That makes implied correlation especially useful in volatility trading. It helps explain why index implied volatility can rise even when the implied volatility of many component stocks has not moved by the same amount. It also helps traders judge whether index options look rich or cheap relative to a basket of single-stock options.
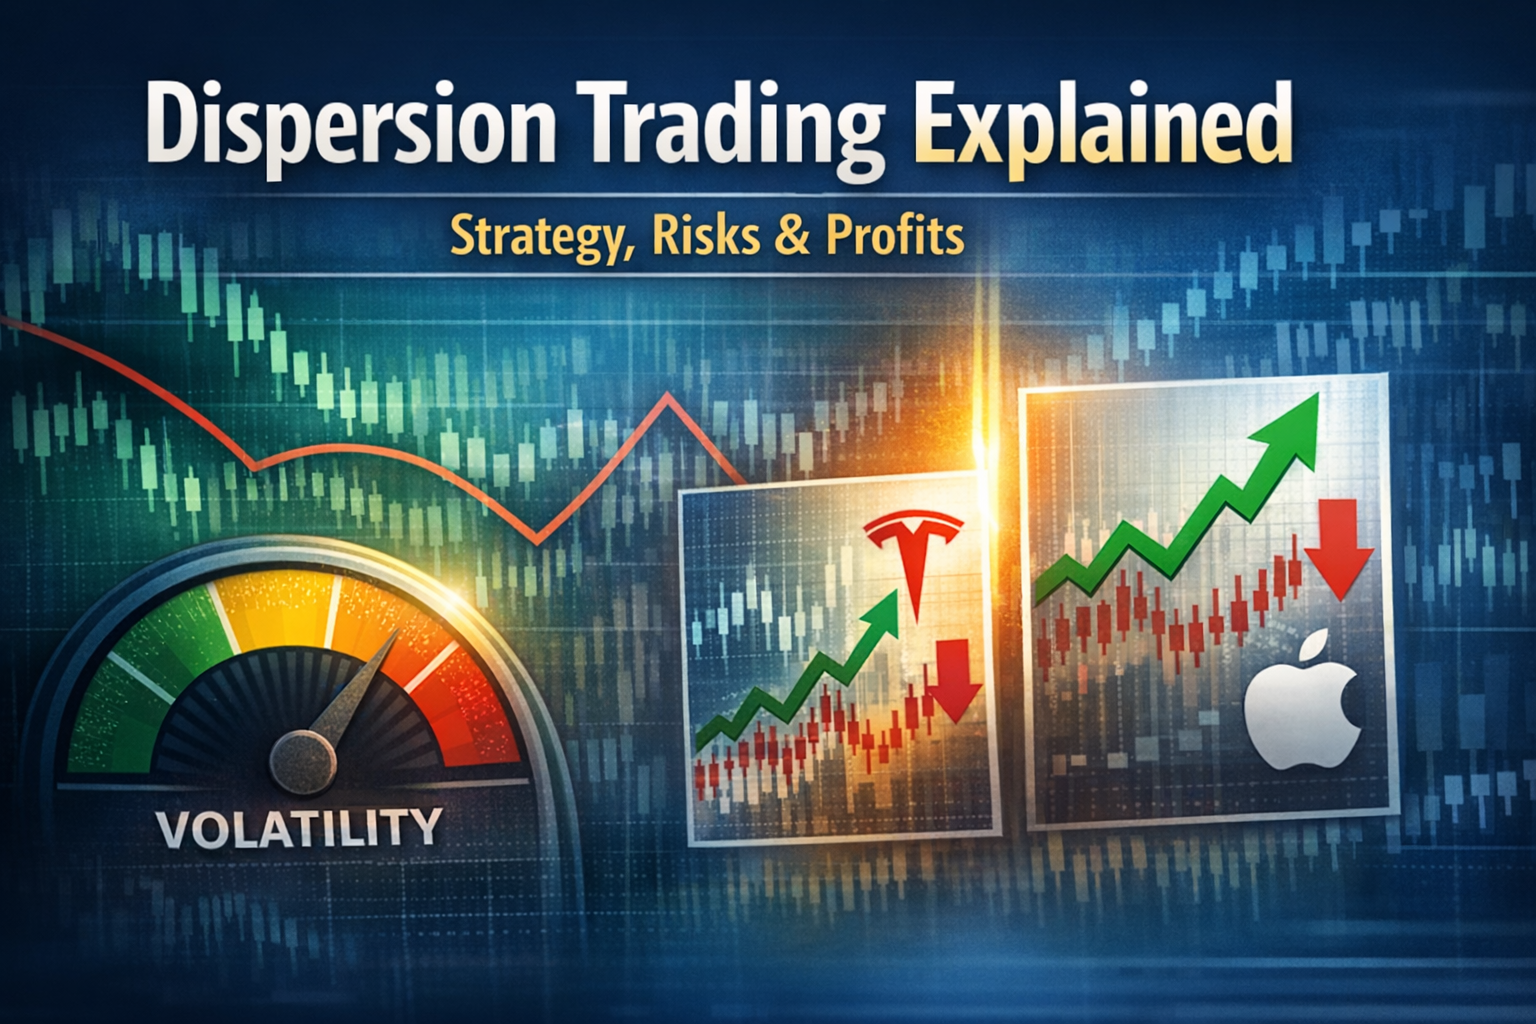
Dispersion trading is the classic use case. In a typical long-dispersion setup, a trader sells index volatility and buys volatility on individual components, usually through at-the-money structures. The trade effectively expresses the view that the implied correlation is too high and may fall.
Some desks compare index-implied volatility with a weighted basket of component implied volatilities to identify relative-value opportunities. If index volatility looks expensive relative to components, implied correlation may be part of the reason.
Portfolio managers also use implied correlation when hedging broad equity exposure. A hedge built with index options can behave differently when stocks begin moving in lockstep, because the value of diversification can shrink quickly during stress.
Implied correlation is forward-looking. It reflects what the options market is pricing now about future co-movement. Realised correlation is backwards-looking. It measures how assets actually moved together over a past period.
The gap between the two can matter. When implied correlation sits well above realised correlation, the market may be pricing in systemic risk, event risk, or stronger demand for index protection than recent price action alone would suggest. That does not guarantee the market is wrong, but it can signal that correlation risk is being priced more aggressively.
This interpretation is consistent with how Cboe frames implied correlation as insight into the relative cost of SPX options versus options on individual stocks.
Several factors can move the implied correlation:
broad macro uncertainty and market stress
Heavy demand for index downside hedges
earnings seasons with either strong dispersion or strong macro alignment
sector concentration inside an index
liquidity conditions and the shape of volatility skew across the option surface
A simple rule of thumb is this: in calm markets, stocks often trade more on company-specific stories, so implied correlation can fall. In risk-off periods, macro forces can dominate,, and many stocks can move together, so implied correlation can rise.
That interpretation aligns with Cboe’s description of implied correlation as a gauge of expected diversification benefits.
Implied correlation is useful, but it is not a standalone truth signal.
First, methodology differs by provider. A published benchmark may use a specific subset of stocks, a specific maturity, and a specific implied-volatility input rule. Second, the number can be affected by supply and demand in index options, component options, or both. Third, it says nothing about direction. It describes expected co-movement, not whether the market will rise or fall.
It also works best when paired with related tools such as implied volatility, volatility skew, and realised correlation. Used in isolation, it can look more precise than it really is.
It measures the options market’s implied estimate of how strongly index components are expected to move together over the option horizon.
It is mainly used in dispersion trading, relative-value volatility analysis, and index hedging. Traders use it to compare the pricing of index options with the pricing of options on individual stocks.
Because investors often buy index protection when macro risk increases, and the market starts pricing more synchronised moves across stocks. That reduces expected diversification benefits.
No. Historical correlation is calculated from past returns. Implied correlation is inferred from current options prices and is forward-looking.
Yes, usually as an analytical signal rather than as a standalone trade. Retail traders can track published implied-correlation indices, compare index and component implied volatility, and use the signal to understand when index protection may be relatively expensive.
Implied correlation links index volatility to the expected co-movement of the stocks inside that index. It is inferred from option prices and helps traders understand whether the market is pricing broad synchronisation or stock-level dispersion. That makes it useful for volatility trading, hedging, and relative-value analysis, especially when read alongside implied volatility, realised correlation, and volatility skew.