Published on: 2026-01-15
Updated on: 2026-01-15
Earnings season is the recurring period each quarter when publicly listed companies release their financial results and forward guidance. These disclosures provided updated insights into revenue, profitability, costs, and outlook, forcing markets to reassess valuation assumptions in a compressed timeframe.
Because earnings season combines new information into short reporting windows, price adjustment becomes abrupt rather than gradual. Stocks frequently reprice outside regular trading hours, liquidity thins, and risk behaves differently than during normal sessions. Understanding how earnings season reshapes volatility, gaps, and exposure is essential for anyone participating in equity markets.
Earnings season concentrates uncertainty into single events. Instead of gradual price discovery, markets reprice through gaps that reflect new information, revised guidance, and shifts in institutional positioning.

The most important principles to understand during earnings season are:
Earnings gaps override technical levels formed before the release.
Overnight risk replaces intraday risk.
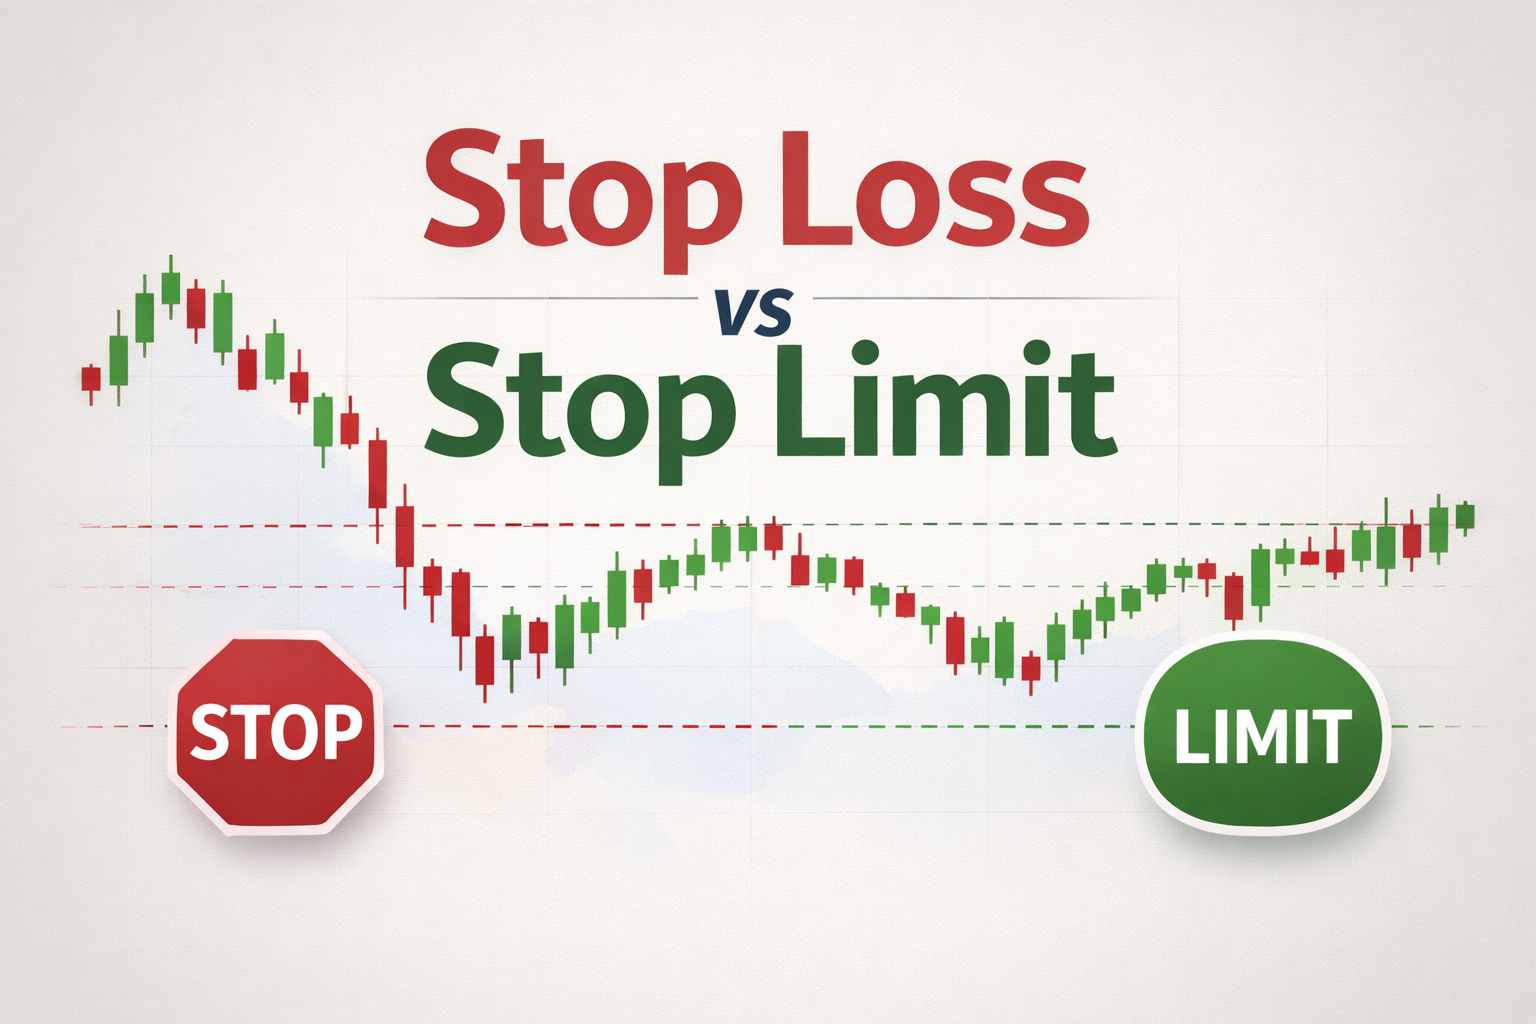
Stop losses do not cap losses during gaps.
Position size is the primary risk control.
Post-earnings price behavior matters more than the headline numbers.
Viewing earnings season as a risk-management exercise rather than a prediction challenge is essential for consistency.
Earnings season follows a predictable quarterly structure. While individual reporting dates differ, results cluster into defined windows that concentrate volatility and correlation across markets.
Volatility is usually highest during the first two weeks of earnings season, when large-cap and sector-leading companies report and reset expectations for the broader market.
| Quarter | Main Reporting Period | Market Behavior |
|---|---|---|
| Q1 | Mid-April to Mid-May | Macro-sensitive guidance, wide dispersion |
| Q2 | Mid-July to Mid-August | Thinner liquidity, larger average gaps |
| Q3 | Mid-October to Mid-November | Sector rotation and positioning reset |
| Q4 | Late January to Mid-February | Highest volume, strongest reactions |
Note: The earnings season calendar is NOT the same as the economic calendar, although both are used to anticipate volatility and market risk. They track different types of events and serve different analytical purposes.
Fiscal years are not standardized globally. Governments and corporations design reporting calendars to align with economic activity, seasonal patterns, and administrative efficiency rather than the calendar year. These differences directly influence when earnings season occurs across regions and why global earnings cycles rarely move in sync.
In many countries, fiscal years are structured to avoid peak holiday periods or to better reflect natural business cycles. In others, historical and institutional factors still shape reporting schedules today.
| Country | Fiscal Year |
|---|---|
| Australia | July 1 to June 30 |
| China | January 1 to December 31 |
| Japan | April 1 to March 31 |
| United Kingdom | April 6 to April 5 |
| United States | October 1 to September 30 |
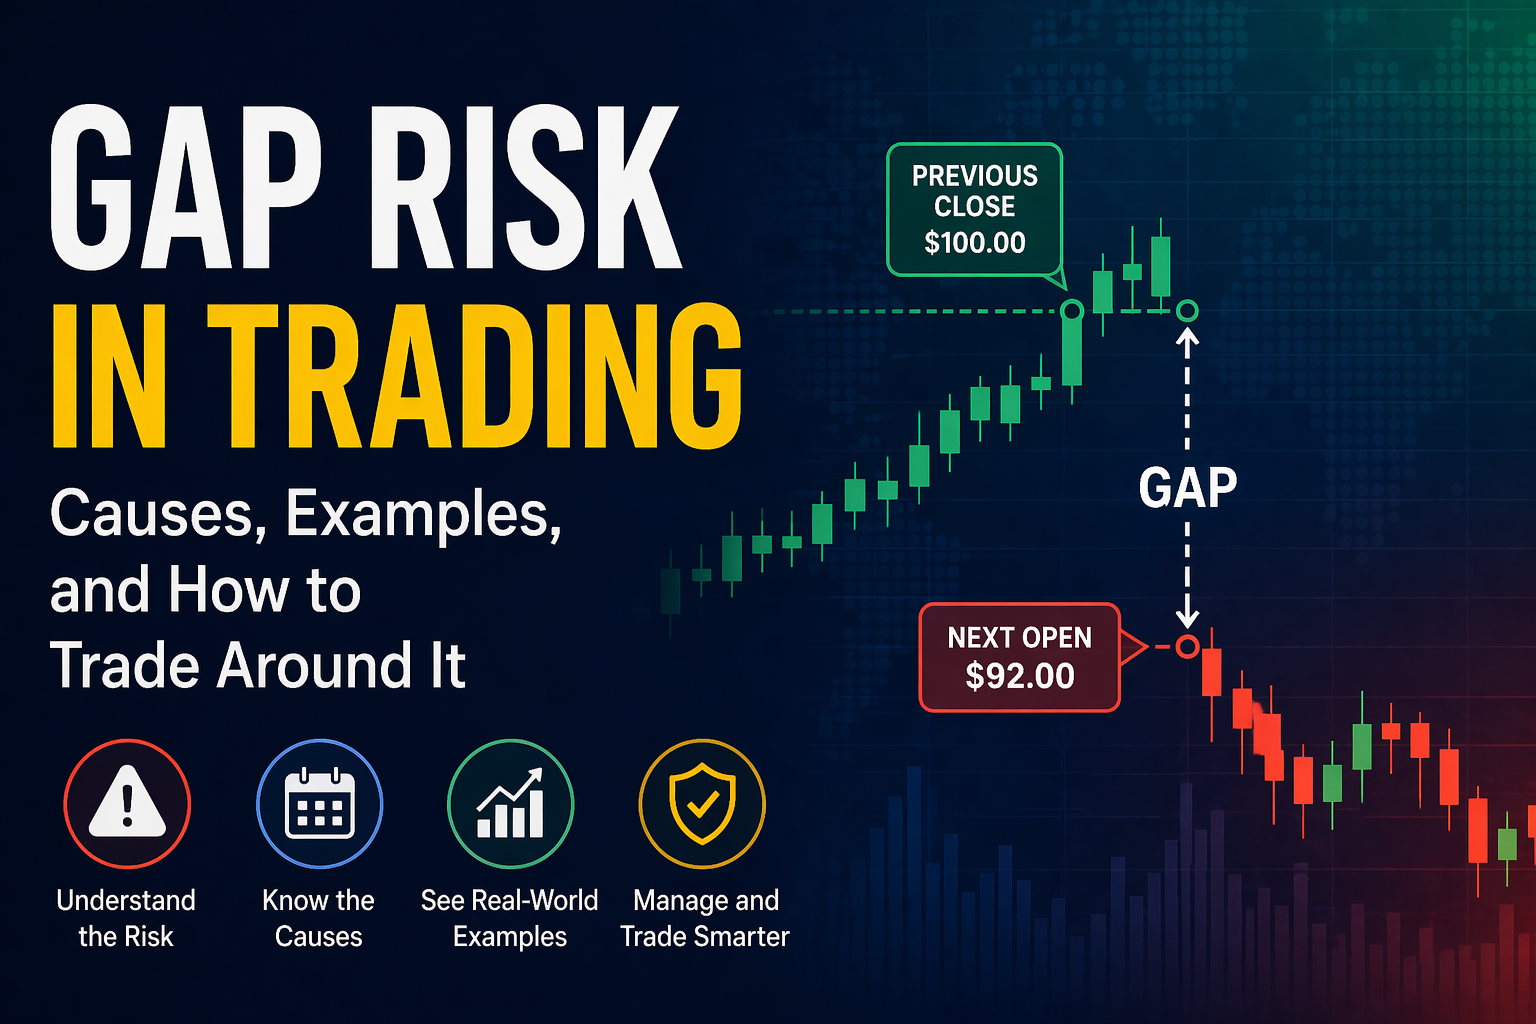
Earnings gaps are sudden price jumps that occur when a stock opens at a significantly different level from its previous close after an earnings announcement. They are a defining feature of earnings season and reflect how markets reprice a company when new financial information becomes available all at once.

During earnings season, companies release results and forward guidance outside regular trading hours. Because liquidity is limited in after-hours and pre-market sessions, prices cannot adjust gradually. Instead, the market reopens at a new equilibrium, creating a visible gap on the chart.
Earnings gaps are driven by three forces acting together:
Expectation reset: Earnings and guidance change assumptions about growth, margins, and cash flow.
Positioning imbalance: Traders positioned for one outcome are forced to reprice or exit simultaneously.
Liquidity vacuum: With fewer buyers and sellers available, the price jumps rather than trade through levels.
There are three common earnings gap structures:
Continuation Gaps: Earnings confirm the existing trend. Institutions add exposure, and price often continues in the same direction over subsequent sessions.
Reversal Gaps: Earnings contradict any prevailing expectations. Crowded positions unwind, leading to sharp repricing and sustained volatility.
Overextension Gaps: Initial reactions overshoot fair value. Prices may retrace partially, but full gap fills are uncommon. During earnings season, gaps represent a valuation reset, not a temporary imbalance. Expecting them to behave like ordinary price inefficiencies creates false confidence.
Stop losses do not protect against earnings gaps. If the price opens beyond the stop level, execution occurs at the first available price, not at the predefined stop.
For example, if a stock closes at $100 and opens at $88 after earnings, a stop at $95 does not limit the loss to 5%. The realized loss reflects the full gap.
This is not poor execution. It is structural market behavior. Earnings season transforms risk into an overnight event, making stop placement irrelevant for loss control.
Position size is the only reliable way to manage earnings season risk. It must be based on gap potential rather than technical stop distance.
A disciplined sizing framework includes:
The stock’s historical average earnings gap
Current implied volatility conditions
Maximum acceptable portfolio-level loss
Example:
Portfolio value: $100,000
Maximum acceptable loss per trade: 1% ($1,000)
Expected earnings gap: 10%
Maximum position size should not exceed $10,000
Most earnings-related losses are not caused by incorrect analysis. They are caused by exposure that is too large relative to the gap risk.
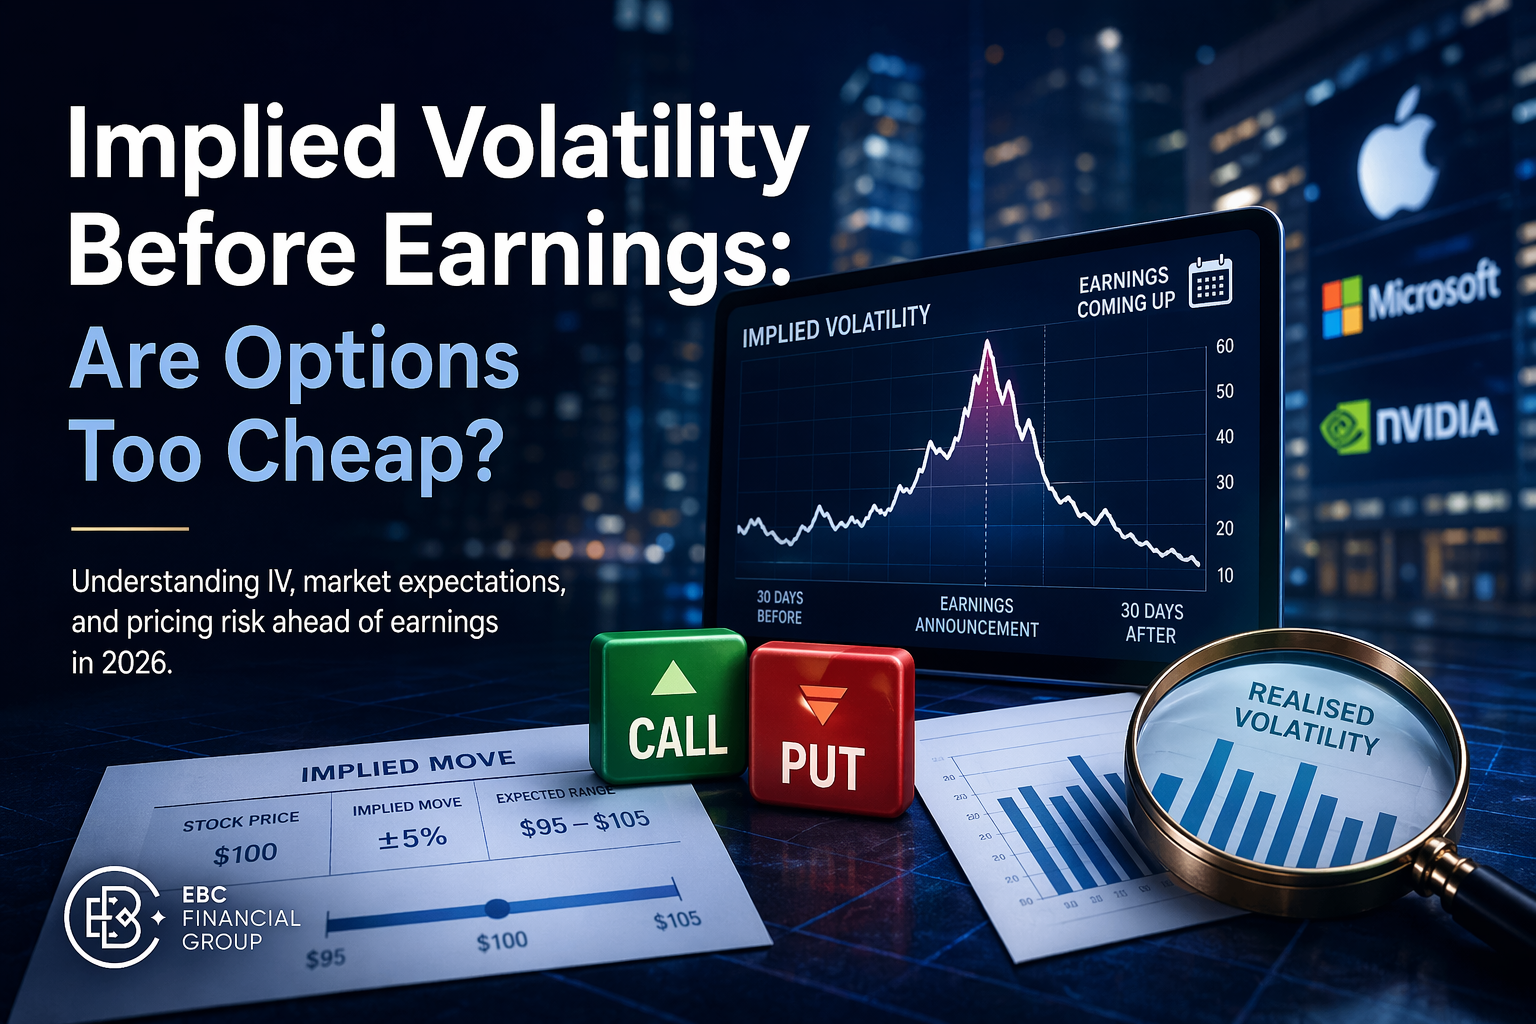
Implied volatility rises into earnings and collapses immediately after the release, a process known as volatility crush. This occurs regardless of whether the price moves up or down.
 Key implications during earnings season:
Buying options requires movement beyond implied expectations.
Directionally correct traders can still lose their money.
Selling options benefits from volatility collapse but carries tail risk.
Options markets efficiently price expected movement but do not fully price extreme outcomes. This is why selling premium appears consistent until a single earnings event produces an outsized loss.
Defined-risk strategies or post-earnings volatility trades provide more stable exposure.
The initial earnings reaction is often driven by emotion, thin liquidity, and short-term positioning. The real signal appears after volatility compresses.
Key post-earnings observations:
Strong results with weak follow-through suggest a distribution.
Weak results with fast recovery indicate expectations were already priced in
Tight consolidation after a large gap often precedes trend continuation
Example:
A stock gaps up 8% on strong earnings, trades sideways for two days, and then fades back toward the gap midpoint. This behavior suggests large holders are using post-earnings liquidity to reduce exposure. The results were good, but already priced in.
Many of the highest-quality earnings season opportunities emerge several sessions after the release, once market interpretation becomes clearer.
Earnings season operates at the sector level. Results from industry leaders often reprice peers, suppliers, and competitors simultaneously.
During earnings season:
Sector correlations temporarily increase.
Sector ETFs often move before individual stocks.
Relative strength provides more information than isolated price moves.
Monitoring sector behavior helps avoid narrow analysis and improves risk awareness during broad repricing phases.
Recurring mistakes include:
Treating earnings days like normal sessions
Oversizing positions based on conviction
Assuming gaps will retrace
Ignoring implied volatility dynamics
Confusing short-term success with repeatable edge
Earnings season consistently rewards discipline over prediction
Earnings season is the quarterly period when publicly listed companies release financial results and forward guidance. These disclosures force markets to reassess valuation, growth expectations, and profitability assumptions. As a result, price movements during earnings season are often sharper and more decisive than during normal trading periods.
Volatility increases because uncertainty is resolved abruptly when earnings and guidance are released. Much of this information enters the market outside regular trading hours, when liquidity is thinner. This leads to price gaps and faster repricing rather than gradual adjustment.
Stop losses are ineffective during earnings because the price can gap beyond the stop level overnight. Trades are executed at the opening price, not the intended stop price. This makes losses larger and less predictable than during intraday trading.
Yes. Earnings season introduces discontinuous risk, where outcomes jump rather than evolve gradually. This makes position size far more important than trade direction in controlling losses.
Options reduce capital exposure but introduce volatility crush risk after earnings are released. Even when the price moves in the expected direction, option premiums can decline sharply. This makes options less predictable than many traders assume during earnings season.
Companies pick the fiscal years that best suit their business cycles, revenue patterns, and operational planning. Retailers often end their fiscal year after peak holiday sales, while industrial or commodity-linked firms align reporting with production or demand cycles.
Earnings season is not unpredictable chaos. It is a structured repricing process with identifiable risks. Gaps are not anomalies. They are how markets absorb new information.
Traders who approach earnings season with clear expectations, controlled exposure, and respect for gap dynamics avoid confusion and reduce drawdowns. In earnings season, disciplined risk management is the edge that endures.
Disclaimer: This material is for general information purposes only and is not intended as (and should not be considered to be) financial, investment or other advice on which reliance should be placed. No opinion given in the material constitutes a recommendation by EBC or the author that any particular investment, security, transaction or investment strategy is suitable for any specific person.