Silver has surged past US $51/oz in 2025. driven by strong industrial demand, ETF inflows, and macro tailwinds.
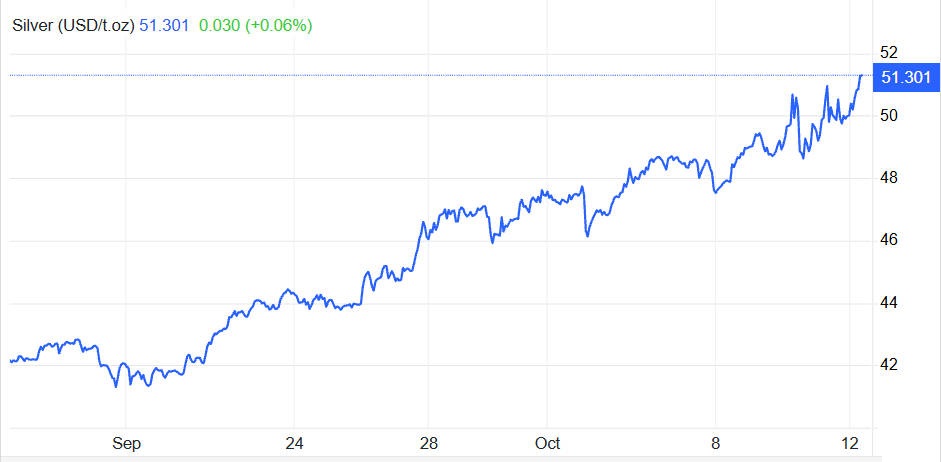
Is this rally sustainable, or is the market approaching a peak?
Momentum may persist short-term, but structural risks, technical exhaustion, and macro factors suggest a potential peak is near—traders should watch key levels closely.
This article examines the latest price action, supply-demand dynamics, technical patterns, trading strategies, and risks to guide your decisions in today's silver market.
Market Snapshot: The State of Silver in 2025
To frame any discussion of silver trading, here's where the metal stands now:
| Indicator |
Latest Value / Observation |
Source / Notes |
| Spot Price |
~ US $51.52 / oz (on 13 October 2025) |
Silver surged ~2% that day amid safe-haven demand. |
| ETF / ETP Inflows (H1 2025) |
95 million ounces net inflow |
This alone exceeded total 2024 inflows. |
| Total ETF Holdings |
~ 1.13 billion ounces |
Only ~7% below the peak in February 2021 (1.21 billion oz). |
| Value of ETF Holdings |
Exceeded $40 billion mid-2025 |
Driven by higher prices. |
| Supply / Demand Imbalance |
Persistent deficits; industrial demand outstrips supply growth |
The Silver Institute and market commentators agree that 2025 continues to run in structural deficit. |
| Analyst Forecasts |
HSBC revised average 2025 forecast to $38.56/oz; trading range $45–$53 |
Reflects stronger gold, safe-haven flows, and volatility assumptions. |
Interpretation:
Silver has moved beyond a "breakout attempt" phase. What was once a resistance near $35 is now historical context; we are in a regime where accumulation, allocation, and structural demand compete with macro risk swings.
The ETF inflows are especially meaningful — 95 million oz in six months is a large shift in the demand profile, one that must contend with limited spare metal supply.
Why Trade Silver in 2025? The Underlying Forces
To trade silver intelligently, you must understand the deep drivers — not just price moves.
1) Industrial Demand: The "Real Use" Engine
Silver is not just a monetary or "store of value" metal — a large share of demand is industrial. Applications include photovoltaics (solar panels), electronics, sensors, medical devices, and more.
Estimates suggest industrial demand in 2025 could exceed 700 million ounces, placing upward pressure on available stock.
As industrial sectors scale (especially renewable energy, battery tech, and advanced electronics), silver usage per unit of economic output may rise.
2) Investment Demand & ETF Dynamics
The surge of 95 million oz into silver ETFs in H1 2025 is not trivial — it shifts the demand curve materially.
Total ETF holdings now stand at ~1.13 billion oz, approaching prior record highs.
India, a major retail silver consumer, has seen steep premiums in their local silver ETFs due to tight supply and strong demand.
Because ETF demand is "paper demand," it competes with physical industrial demand for limited metal supply, especially in times of inventory tightening.
3) Supply Inertia & Structural Constraints
Silver supply has limited elasticity. Many silver mines are by-product operations, meaning silver is mined alongside base metals (like copper, lead, zinc). Thus, silver production is partly constrained by base metal economics, not silver price alone.
The global mine output, even before 2025. has struggled to grow meaningfully. Any increase tends to be incremental and slow.
Above-ground inventories and recycling provide some buffer, but when both industrial and investment demand rise simultaneously, the competition for metal intensifies.
4) Macro Tailwinds & Sentiment Shifts
A weaker U.S. dollar, dovish prospects from the Federal Reserve, and global monetary easing increase the appeal of non-yielding assets like silver.
Geopolitical uncertainty or crises tend to push capital into "hard assets" and safe havens, boosting silver sentiment.
Inflation hedging behaviour: when fiat asset valuations seem unstable, metals attract interest.
In summary, trading silver in 2025 is not just riding momentum — it's participating in a fundamental regime where physical demand, constrained supply, and financial flows are nearly colliding.
Technical Landscape: Patterns, Levels, and Structure
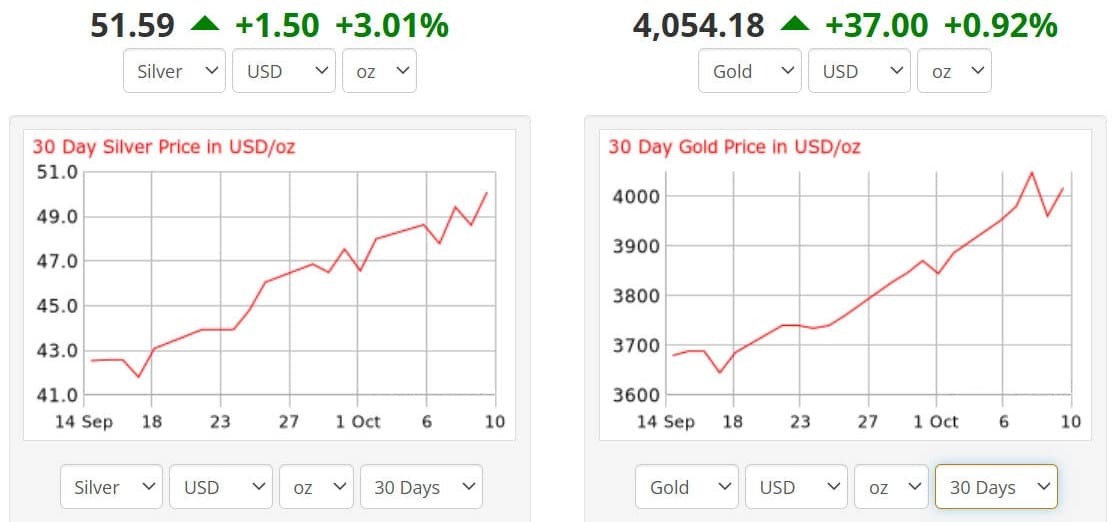
To trade silver well, reading the chart is critical. Here's how things look in 2025.
1) Trend and Regime Shift
The move above $35 is now well behind us; silver is in a higher trading regime, with prior resistance zones now potential support.
Longer–term moving averages (50. 100. 200 day) are likely aligned upward, confirming trending bias (though one must check current charts).
Momentum oscillators like RSI and MACD may show bullish bias but likely also warn of overbought zones and reversion risk.
2) Key Levels to Watch
Support zones: $48 (recent consolidation lows), $45 (psychological and prior structural support)
Resistance / target zones: $55. then $60+ if momentum continues
Charts may show "retest zones," "volume gaps," or prior supply vertices to watch for price reactions.
3) Volume and Confirmation
A true breakout is best judged on volume expansion, not just price crossing a level.
Weekly closes above resistance (not just intraday bursts) matter more.
Divergences (e.g., falling volume on rise, bearish MACD divergence) are red flags of possible exhaustion.
How Traders Are Positioning in 2025
Here's how participants in the market are structuring exposure and engagement.
1) Core + Satellite Approach
2) Futures & Leverage
The futures market, especially COMEX, remains a principal arena for leveraged exposure, hedging, and short-term directional bets.
3) Options and Volatility Plays
Market participants increasingly use options (straddles, strangles, spreads) around macro events (Fed announcements, inflation data, geopolitical shocks) to profit from volatility.
4) Equity Proxies & Streaming
Silver mining stocks, royalty/streaming companies, and related equities offer leveraged exposure to metal price moves, but with added risks (operational, geological, country risk).
5) Geographic and Local Market Dynamics
Price Scenarios & Forward Outlook (3–12 Months)
Here are plausible price paths and what would drive them:
| Scenario |
Key Drivers |
Indicative Range |
| Bullish Case |
Continued heavy ETF inflows, dovish Fed, weak USD, industrial acceleration |
$55 – $70+ |
| Base / Consolidation |
Mixed macro, profit-taking, slower inflows balanced by demand |
$48 – $55 |
| Downside / Correction |
USD strength, rising real yields, sentiment reversal |
$40 – $48 |
Analyst forecasts reflect differing views: HSBC expects average ~$38.56 for 2025. with a trading range of $45–$53. That means most upside pressure is likely to play out in phases or spikes, not smooth linear gains.
Risks & Caveats Every Silver Trader Must Watch
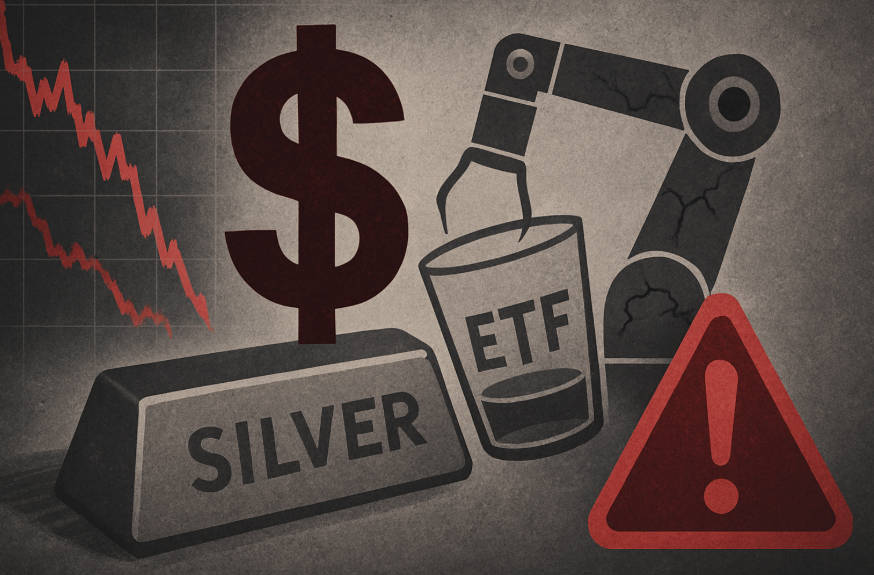
No matter how bullish the case may look, there are real risks that could upend a trade silver thesis.
1) Real Yield and Rate Surprises
If real interest rates rise (or Fed becomes hawkish), non-yielding assets like silver become less attractive.
2) U.S. Dollar Rebound
A stronger dollar tends to put downward pressure on dollar-priced commodities, including silver.
3) ETF Outflows / Sentiment Reversal
If sentiment reverses, massive outflows from silver ETFs could erode the demand cushion that helped drive the run.
4) Industrial Demand Shock
A slowdown in electronics, solar rollout delays, or industrial disruption could weaken the consumption driver.
5) Supply Surprises
Unexpected increases in recycling, mine discoveries, or easing of bottlenecks could relieve tightness.
6) Technical Exhaustion
After sharp runs, markets often correct hard; proper position sizing and stop discipline are essential.
7) Regulatory / Tax / Local Market Constraints
In some jurisdictions, rules on precious metals trading, capital flows, or taxation can turn a good trajectory into a logistical problem.
Conclusion: Trade Silver Wisely in 2025
2025 is not a "normal year" for silver. It is a year where structural demand, constrained supply, and financial flows are colliding in dramatic fashion. For traders, this presents both compelling opportunity and heightened risk.
To navigate this successfully:
Use clear triggers for entry (confirmed breakouts, volume confirmation).
Apply rigorous risk controls (stop losses, size limits).
Monitor macro indicators (Fed policy, real yields, USD).
Stay alert for sentiment shifts or flow reversals.
Combine strategies (momentum, range, relative trades) rather than relying on a single method.
If momentum continues, silver could indeed test $60 or more. But if macro tides turn, sharp retraction is possible. A disciplined approach, grounded in fundamentals and technical clarity, is essential when you trade silver in 2025.
Frequently Asked Questions
Q1: Why is silver rallying so strongly in 2025?
A1: Industrial demand, safe-haven flows, ETF inflows, a weak USD, and dovish monetary policy are all driving silver's surge.
Q2: What are key price levels to watch?
A2: Support zones: $48 and $45/oz. Resistance zones: $55 and $60+. Watch for confirmed breakouts with volume.
Q3: Should I trade silver via physical, ETFs, or futures?
A3: Core long-term exposure can be physical or ETFs. Futures and options suit short-term, leveraged, or event-driven trades.
Q4: How can I manage risks in silver trading?
A4: Use stop-losses, monitor USD and interest rates, track ETF flows, and diversify strategies (momentum, range, relative value).
Q5: Is silver still a good long-term hedge?
A7: It can be, particularly in a low-rate, high-inflation, or geopolitical uncertainty environment, but exposure should be balanced with risk controls.
Disclaimer: This material is for general information purposes only and is not intended as (and should not be considered to be) financial, investment or other advice on which reliance should be placed. No opinion given in the material constitutes a recommendation by EBC or the author that any particular investment, security, transaction or investment strategy is suitable for any specific person.
