Published on: 2026-03-25
TSLA is trading at $383.03, above its 20-day EMA of $382.40, but below the 50-day EMA of $385.96 and the 200-day EMA of $400.45. This configuration indicates short-term stabilization rather than a confirmed bullish reversal.
TSLA’s performance now reflects demand for EVs, energy storage, charging infrastructure, software, and autonomous technology.

The current price action of $383.03 places TSLA in a “wait-and-see” corridor. While the stock has successfully reclaimed its 20-day EMA ($382.40), it remains capped by the 50-day EMA ($385.96) and the psychologically significant 200-day EMA ($400.45).
This indicates short-term stabilization rather than a definitive bullish reversal.
| Indicator | Reading | Signal |
|---|---|---|
| RSI (14) | 50.80 | Neutral |
| MACD (12,26) | -1.05 | Bearish |
| ADX (14) | 26.01 | Trend active |
| ATR (14) | 5.07 | Moderate volatility |
| EMA 20 | $382.40 | Short-term support |
| EMA 50 | $385.96 | First resistance |
| EMA 200 | $400.45 | Major resistance |
The Average True Range (ATR) of 5.07 suggests that the immediate resistance levels are well within a single day’s trading range.
With the MACD remaining negative, buyers must achieve a daily close above $386.88 to confirm upward momentum.
Tesla’s valuation is being structurally re-rated. According to 2025 year-end filings, the company reported $12.8 billion in energy generation and storage revenue and $12.5 billion in services and other revenue.
This diversification is no longer a “side project”; it now accounts for nearly 25% of the total revenue mix.
With 46.7 GWh deployed in 2025, Tesla’s energy segment is growing at 26.6% year-over-year. The upcoming launches of Megapack 3 and the 20 MWh Mega Block solution in late 2026 are expected to further reduce automotive revenue dominance.
For investors, this provides a “valuation floor” that was historically absent during EV-only demand slumps.
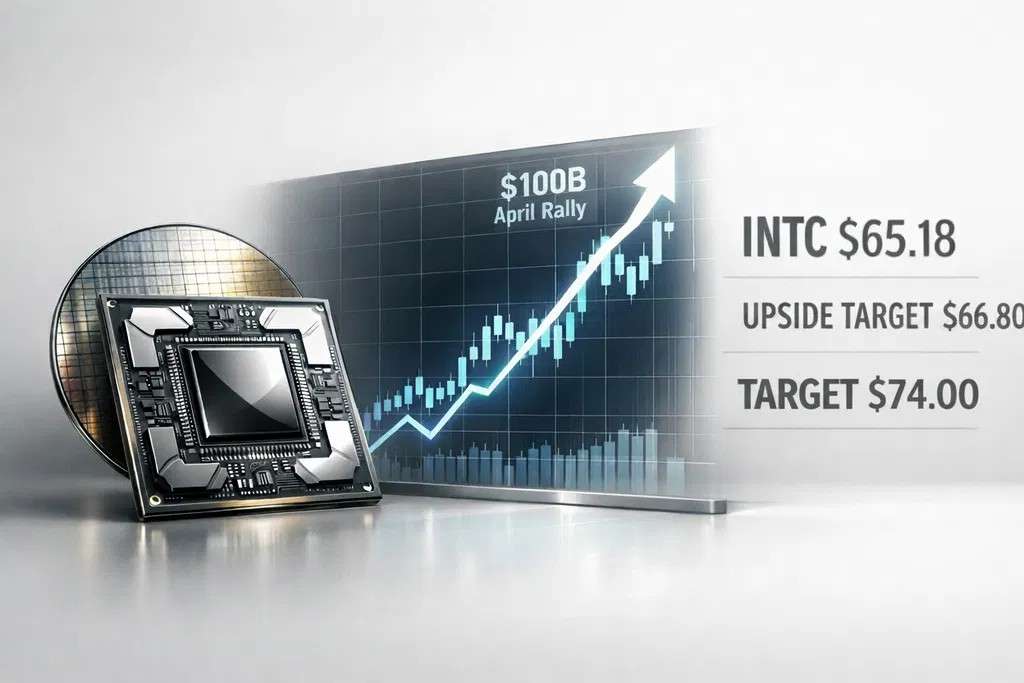
Tesla has begun installing Cybercab production lines, with mass production scheduled for April 2026.
The shift toward a high-margin software-as-a-service (SaaS) model via the Robotaxi network is the primary driver for the wide variance in analyst price targets, which currently span from $330 to $600.
To solidify this forecast, we utilize a tiered technical model based on the current $384.01 pivot and the ATR-based volatility expansion.
The expected price target ($P_t$) for the next quarter can be modeled by:
Pt=Pcurrent±(ATR×t)
Where “t” represents the trading days. Given the current density of EMAs, we project two primary paths:
If TSLA closes above $386.88, it may trigger a technical move toward the 50-day EMA. Sustained trading above $392.12 would likely prompt a rapid test of the 200-day EMA at $400.45.
Target: $425.00 by Q3 2026.
Catalyst: Successful April Cybercab production milestones and stable energy margins.
If TSLA fails to hold support at $381.64, lower support levels at $378.77 and $376.40 become relevant. Breaching these levels would indicate market concerns about delays in regulatory approval for unsupervised FSD.
Target: $340.00 (Long-term support).
Catalyst: Capex expansion exceeding $20 billion, leading to short-term free cash flow concerns.
Margin Compression: Tesla’s plan to invest over $20 billion in 2026 for AI and manufacturing capacity may lead to temporary earnings-per-share (EPS) suppression.
Regulatory Headwinds: The timeline for “unsupervised” FSD remains the ultimate “binary risk.” Any negative NHTSA headlines regarding Robotaxi safety could invalidate the current stabilization.
Competitive Landscape: Low-cost international competitors, such as BYD, continue to pressure core automotive gross margins, which were approximately 20.1% in late 2025.
The year 2026 is widely regarded as the “Year of Autonomy” for Tesla. Integrating Optimus robot production and expanding the Robotaxi app in cities such as Austin and Las Vegas may shift TSLA’s perception from a car company to an AI and robotics conglomerate among institutional investors.
Traders should watch for volume expansion on up-days as a sign of institutional accumulation.
For traders looking to follow the EV stock market more actively, EBC Financial Group offers a regulated brokerage environment under the oversight of the FCA, ASIC, FSCA, and CIMA.
With recent recognition for execution and platform quality, EBC is positioned as “The World’s Best Broker” for traders who value a professional, regulated setup.
The 200-day EMA at $400.45 is the key trend level. A sustained move above it would strengthen the bullish case.
No. TSLA has stabilized, but it still trades below key medium-term trend indicators.
Immediate support sits at $381.64. Below that, focus shifts to $378.77 and $376.40.
Tesla’s $383.03 price point represents a delicate equilibrium. Technically, the stock is fighting to reclaim its medium-term trend lines. Fundamentally, the story is moving away from the “EV winter” and toward a “Robotics Spring.”
Traders should maintain a neutral-to-bullish stance only upon a confirmed close above $386.88, with a primary target of $400.45. Conversely, a slide below $381.64 mandates a defensive posture, as it would signal a continuation of the broader corrective phase.
Disclaimer: This material is for general information purposes only and is not intended as (and should not be considered to be) financial, investment or other advice on which reliance should be placed. No opinion given in the material constitutes a recommendation by EBC or the author that any particular investment, security, transaction or investment strategy is suitable for any specific person.