Published on: 2026-04-14
Updated on: 2026-04-14
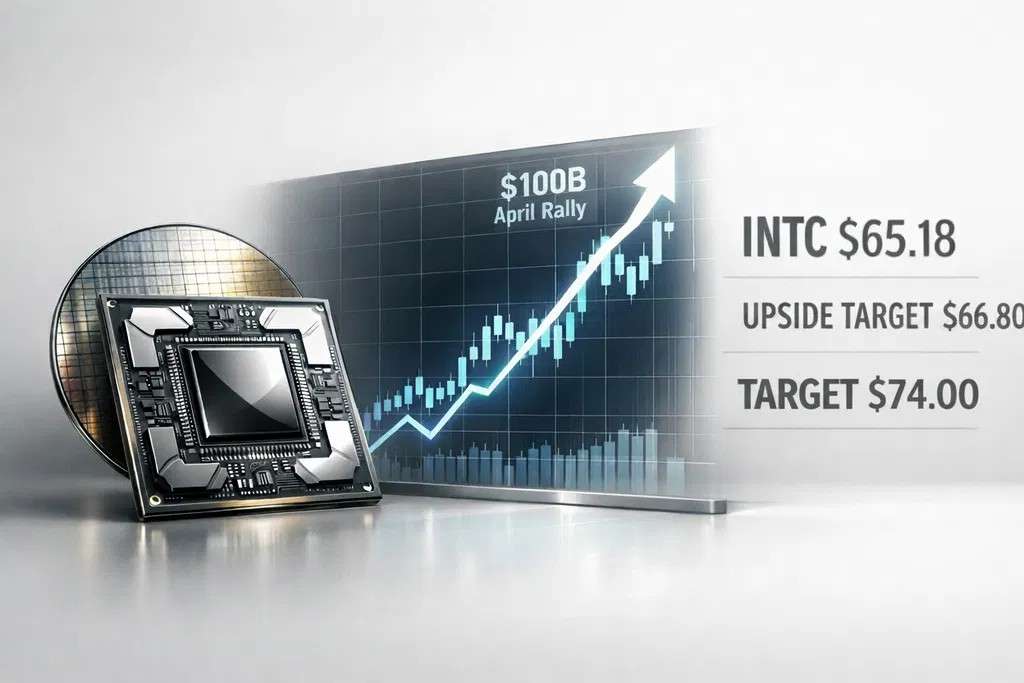
Intel stock closed at $65.18 on April 13, valuing the company at roughly $327.3 billion based on 5.02 billion shares outstanding.
The April move is unusually extended, with INTC about 37% above its 50-day average and roughly 79% above its 200-day average.
Daily technicals still point up, but the stock is overbought. The RSI is 75.43, the MACD is 3.45, and the price is significantly above the 20-day, 50-day, and 200-day exponential moving averages.
The first upside target is $66.80. A clean break there opens $70.00 and then $74.00, while the first meaningful pullback zones sit near $59.40 and $57.00.
Short interest is only 2.38% of shares outstanding, which suggests this rally is being driven more by re-pricing and fresh demand than by a classic short squeeze.
| Indicator | Value | Read |
|---|---|---|
| Price | $65.18 | Strong breakout above trend averages |
| RSI (14) | 75.43 | Overbought |
| MACD (12,26) | 3.45 | Bullish trend, but stretched |
| EMA 20 | $50.41 | Price is far above short-term trend |
| EMA 50 | $47.28 | Medium-term trend is firmly bullish |
| EMA 200 | $36.53 | Long-term trend has fully turned up |
| ATR (14) | $3.08 | Volatility is elevated |
| ADX (14) | 22.58 | Trend is real, but not yet at exhaustion by trend strength alone |
| Support 1 | $59.38 | First pullback zone |
| Support 2 | $57.04 | Deeper retracement support |
| Support 3 | $55.69 | Last major near-term support before trend damage |
| Resistance 1 | $66.76 | Immediate breakout target |
| Resistance 2 | $70.00 | First round-number extension |
| Resistance 3 | $74.00 | Measured-move target if momentum survives earnings |
| Trend | Bullish | Higher highs and higher lows |
| Momentum | Hot but crowded | Buyers still in control, but late entries carry higher risk |
The table above presents the latest daily technical readings from TipRanks, published on April 13, 2026, along with a price map based on pivot levels and the breakout structure for April.
The technical message is clear. Above $66.76, the next clean upside marker is $70.00. Using 5.02 billion shares outstanding, that would imply a market value near $351.4 billion. If the stock can hold that breakout through earnings, $74.00 becomes a realistic second target, implying roughly $371.5 billion in market value.
On the downside, a pause would not be surprising at all. RSI above 75 usually means momentum is crowded, not that the trend is finished.
The first zone to watch is $59.38. If that fails, the next area is $57.04. Only a break below roughly $55.69 would begin to suggest that the April breakout is losing its structure rather than just cooling off.
In simple terms, the trend is clearly bullish; however, the stock is extended enough that price swings of $3 to $5 could occur without altering the overall upward trend.

Bulls want to see Intel hold above the low $60s and turn $62-$63 into support. If that happens, the chart still points to the mid-$66 area first, then the low $70s. A calm pullback on lighter volume would actually help the trend by easing the overbought condition.
Bears need a daily break back below $58.95 to start cooling the move. A deeper slide under $52.91 to $50.59 would do more damage because it would put the breakout zone back in play and suggest the rally had become too stretched too quickly.
The most important near-term driver is April 23 earnings. Intel already told the market to expect first-quarter revenue of $11.7 billion to $12.7 billion and non-GAAP EPS around break-even.
After a move this large, investors will focus less on whether Intel beats by a few cents and more on whether management can raise confidence around margins, foundry execution, and the second-half demand picture.
April's rally was helped by a new AI infrastructure collaboration and the decision to regain full ownership of Fab 34. Both moves feed the same market narrative: Intel is becoming more central to future compute capacity and has more direct control over its manufacturing base.
If management reinforces that story with disciplined spending and cleaner margin signals, the stock can justify another leg higher.
In conclusion, the INTC chart still favors the bulls while price holds above the low $60s, but the stock is stretched, and earnings are close. It is trading in a strong uptrend, with $66.76, $70.00, and $74.00 as the next upside markers.
If Intel backs up the rally with cleaner margins, steady demand, and firm execution, this breakout can keep going. If not, a pullback toward the high-$50s would look more like a reset than a collapse.
Disclaimer: This material is for general information purposes only and is not intended as (and should not be considered to be) financial, investment or other advice on which reliance should be placed. No opinion given in the material constitutes a recommendation by EBC or the author that any particular investment, security, transaction or investment strategy is suitable for any specific person.