Published on: 2026-03-31
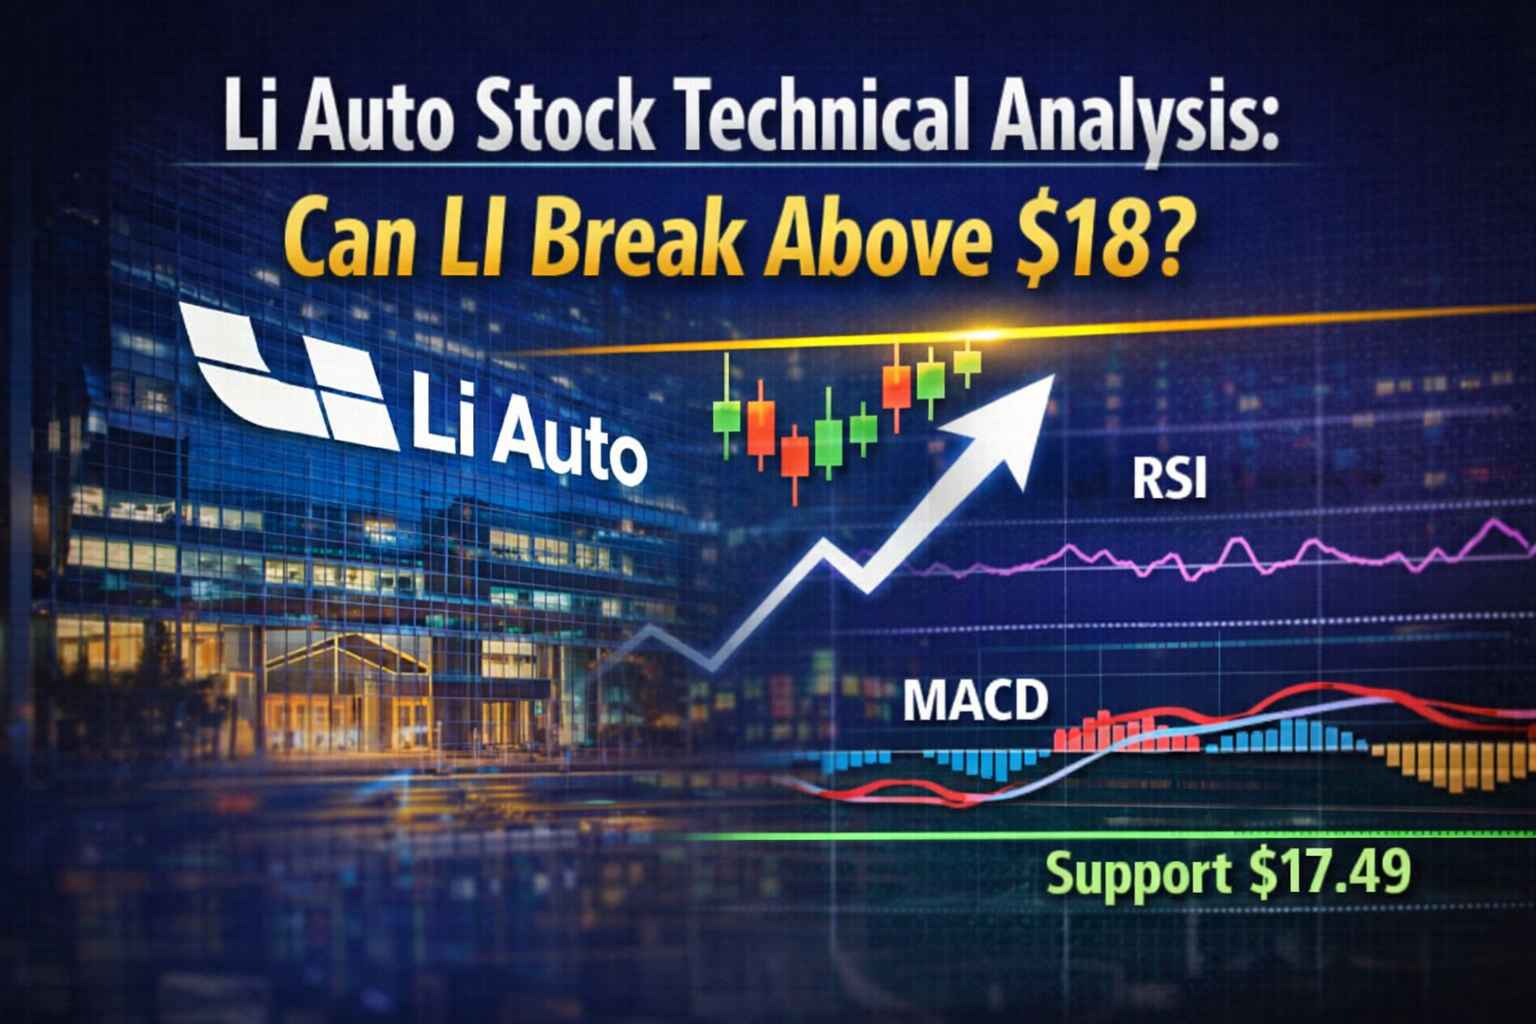
Li Auto stock technical analysis is back in focus because LI is testing a decisive pivot zone just below near-term resistance.
With the stock trading around $17.55 on March 31, 2026, the next move will depend on whether buyers can sustain momentum above short-term moving averages or whether sellers regain control at the same levels.
That is why the current setup matters. LI is no longer in a sharp decline, but it has not done enough to confirm a bullish reversal either. After falling to $15.73 on January 20 and rebounding to $19.20 on February 11, the stock has since consolidated in the upper-$17 area. The chart is now forcing a decision.
From a price-structure perspective, LI looks more like a stock in consolidation than one entering a fresh bullish leg. The stock is trading almost exactly on its 50-day SMA at $17.57, which suggests short-term equilibrium rather than directional conviction.
The broader trend, however, still looks weak. LI remains well below its 200-day SMA at $21.58, which means the longer-term trend has not yet turned. That gap tells traders an important story: near-term selling pressure has eased, but the stock is still trading below a major trend marker.

For now, LI is trying to build a base, not break out.
| Indicator | Reading | Signal |
|---|---|---|
| Price | $17.55 | Testing a pivot zone |
| RSI (14) | 47.41 | Neutral |
| MACD (12,26) | -0.01 | Slightly bearish |
| 50-day SMA | $17.57 | Short-term balance |
| 200-day SMA | $21.58 | Long-term resistance |
| Support | $17.49 / $17.44 | Base must hold |
| Resistance | $17.55 to $17.61 | First breakout band |
| Trend | Neutral to bearish | Base-building phase |
| Momentum | Neutral to slightly bearish | Needs follow-through |
The daily technical picture remains cautious. RSI near 47.41 shows the stock is neither oversold nor overbought, while MACD at -0.01 suggests momentum remains soft rather than decisively bullish.
The key support zone sits around $17.49 and $17.44. On the upside, the first resistance band stands between $17.55 and $17.61. That leaves LI in a narrow range where a relatively small move can shape the next short-term trend.
A credible bullish shift needs more than a one-day rebound. First, LI needs to clear the $17.55 to $17.61 resistance pocket and hold above it on a closing basis. That would show buyers can absorb supply at the first test.

Second, the stock needs to reclaim the recent March swing area in the upper-$18 range. Until that happens, rallies are more likely to be treated as range movement than the start of a durable upside trend.
The constructive part of the chart is that LI is no longer trading far below its 50-day average. That reduces immediate downside pressure. The problem is that momentum has not yet turned decisive.
If LI falls below $17.49, the next warning signal would be a move toward $17.44 and then back into the mid-$16 region, where the stock traded repeatedly in January and early March.
That would suggest the current base is failing and that sellers are regaining control before any breakout is confirmed. In that scenario, the recent stabilization would begin to look more like a pause in a weak trend than the start of a recovery.
The bigger risk is that LI still trades materially below its 200-day SMA. When a stock remains under that level, rebounds often attract selling from investors looking to exit into strength.
Pure technical analysis still needs catalyst awareness. Li Auto reported fourth-quarter 2025 revenue of RMB28.8 billion, or US$4.1 billion, along with 109,194 deliveries for the quarter. It also announced a US$1.0 billion share repurchase program on March 24, 2026.
Those developments can shape sentiment, but price action still lacks breakout confirmation. The market is not ignoring the headlines. It is simply waiting for stronger evidence on the chart.
The next delivery update also matters. Li Auto reported 26,421 vehicles delivered in February 2026, which means near-term delivery data remains a live catalyst for traders watching whether the current base can hold.
For traders seeking exposure to leading EV names, access and execution matter as much as market direction. EBC Financial Group provides access to widely followed EV stocks, including Tesla, within a regulated trading environment built for active market participants.
With oversight from the FCA, ASIC, FSCA, and CIMA, EBC offers a professionally structured framework centered on market access, regulatory standards, and disciplined trading conditions.
No. With RSI near 47, LI is neutral rather than oversold.
The first breakout band sits between $17.55 and $17.61. A clean close above that zone would improve the short-term setup.
Short term, LI is neutral. Longer term, the chart remains cautious because price is still below the 200-day SMA.
Yes, but only if buyers clear near-term resistance first and then push the stock back into the upper-$18 range with follow-through.
A sustained move below $17.49 would weaken the setup and reopen downside risk.
The current LI technical analysis points to a stock at an inflection point. Li Auto is no longer in a sharp downtrend, but it has not done enough to warrant a bullish call either.
Price is hovering around the 50-day average, RSI is neutral, and MACD remains slightly negative. That combination usually describes a market waiting for a trigger, not one already in breakout mode.
For traders, the roadmap is clear. A close above the $17.55 to $17.61 zone would improve the short-term picture, while a break below $17.49 would put the current base under pressure. Until LI proves it can reclaim resistance with momentum, the cleaner view is cautious accumulation at best, not a confirmed trend reversal.
Disclaimer: This material is for general information purposes only and is not intended as, and should not be considered, financial, investment, or other advice on which reliance should be placed. No opinion given in this material constitutes a recommendation by EBC or the author that any particular investment, security, transaction, or strategy is suitable for any specific person.