Published on: 2026-06-30
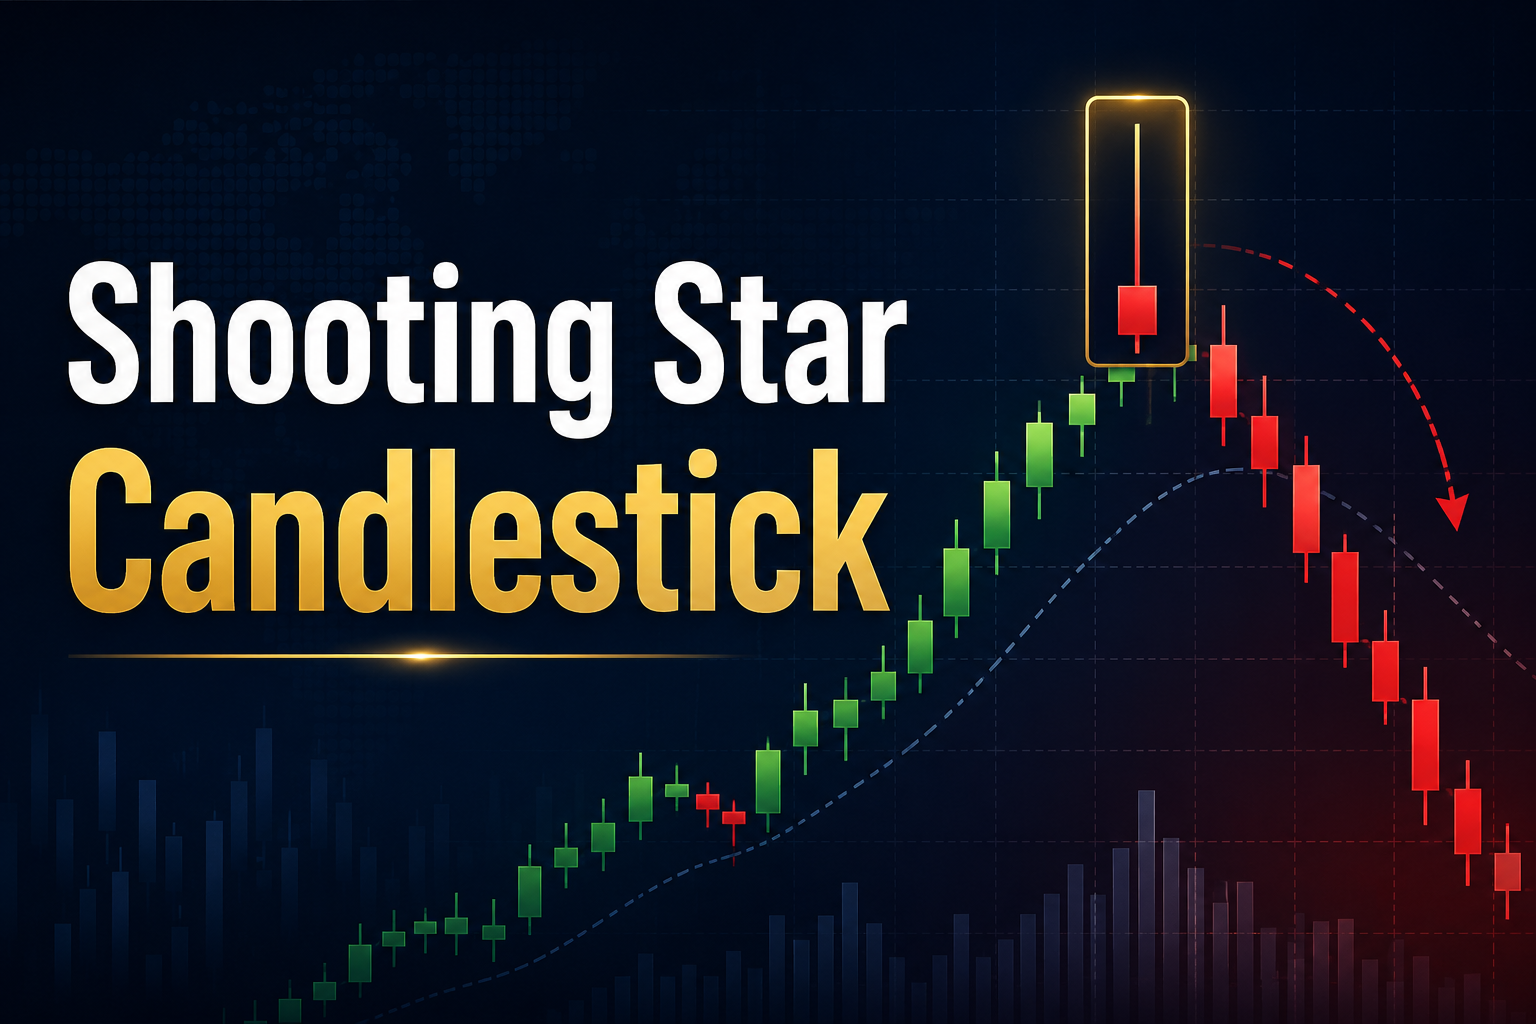
A shooting star candlestick pattern appears after prices have moved higher and warns that buying strength may be fading. Buyers push the market higher during the session, but sellers push the price back down near the candle's lower end before the close.
A shooting star candlestick is a bearish reversal warning that appears after an uptrend or upward swing.
The pattern has a small body near the candle low, a long upper wick, and little or no lower wick.
The long upper wick shows that buyers pushed price higher but failed to keep control into the close.
The signal is stronger near resistance, with bearish follow-through, higher volume, or weaker momentum.
A move above the shooting star high weakens the bearish setup, as it indicates buyers have reclaimed the rejected area.

A shooting star is a single-candle bearish reversal pattern. It usually forms after a price rally and shows that the market tried to move higher but failed to hold those gains. The candle has a small real body near the lower end of the range and a long upper shadow.
The upper wick is the most important visual feature. It should normally be at least twice the size of the real body. This long wick shows that buyers were able to push price higher during the session, but sellers became stronger before the close.
The candle can be red or green. A red shooting star is typically seen as more bearish because the price closes below its open. A green shooting star can still carry bearish meaning if it closes near the lower part of the candle after rejecting a clear resistance level.
Context decides whether the candle is useful. A shooting star only works as a bearish warning when it forms after prices have already moved higher. If the same shape appears after a decline, traders may interpret it differently, often as an inverted hammer rather than a shooting star.
A shooting star forms when buyers begin the session with control. Price rises above the open, and the market appears ready to continue upward. Later, sellers step in and push price back toward the opening level or session low.
The candle shows a failed attempt to hold higher prices. The long upper wick records the rejected move. The small body near the low shows that sellers were stronger by the close.
This is why the pattern is often linked to buyer exhaustion. It suggests the upward move may be losing momentum, especially if the candle appears after a strong rally or near a level where price has failed before.
A valid shooting star needs three things: the right trend, the right candle shape, and the right location. Without these three conditions, the pattern becomes less useful.
Price should already be moving higher. The pattern is meant to warn of a possible bearish reversal after an upward move. If there is no prior rally, there is nothing meaningful to reverse.
The candle should have a small body near the lower end of the range. The upper wick should be much longer than the body, usually at least twice the body size. The lower wick should be small or almost absent.
The candle should appear near a useful price level. A shooting star near a previous high, horizontal resistance zone, moving average, falling trendline, or Fibonacci retracement level carries more weight than one in the middle of a choppy range.
A shooting star is only a warning until price confirms it. Traders usually look for bearish follow-through before treating the shooting star pattern as a stronger reversal signal.
The simplest confirmation is the next candle closing lower. A close below the shooting star’s low, or below its real body, indicates that sellers remained active after the first rejection. If the next candle is weak, mixed, or quickly recovers above the shooting star's high, the signal weakens.
Resistance confirmation also helps. A shooting star near a previous swing high or clear resistance zone gives the candle a stronger reason to matter. The market has already shown that sellers may appear around that area.
Momentum indicators can add another layer. RSI divergence, overbought RSI, weakening MACD momentum, or slower upward price movement can all suggest that the rally is losing strength. These signals do not guarantee a reversal, but they suggest that buying pressure is weakening.
Volume can also improve confirmation. Higher volume during the rejection suggests stronger participation from sellers. Low volume makes the signal weaker because the wick may reflect thin trading rather than real selling pressure.
A shooting star trade needs a clear plan. The pattern should help traders define entry, invalidation, and target areas rather than act as a standalone sell signal.
A conservative method waits for bearish confirmation. This may be a candle closing below the shooting star low or a clear move below the candle’s real body. Waiting can reduce false signals because the market has shown that sellers are still present.
An aggressive method enters closer to the shooting star low. This gives a better entry price but carries higher risk because confirmation may not have arrived yet. This approach usually needs stronger supporting evidence, such as resistance, bearish divergence, or high-volume rejection.
The common invalidation level is above the shooting star high. If the price breaks above that high and holds there, the rejected area will have been reclaimed. The bearish setup becomes weaker because sellers failed to defend the wick high.
The shooting star pattern works best when price has already moved far enough that buyers are stretched. A long rally into resistance lends the candle greater meaning, as the market is already vulnerable to profit-taking or selling pressure.
The pattern also works better on higher timeframes. A shooting star on a daily or four-hour chart usually carries more weight than one on a one-minute chart because it reflects more trading activity. Lower-timeframe candles can still be useful, but they tend to produce more false signals.
The best setups usually have a clean prior move, a visible resistance area, bearish follow-through, and enough distance to the next support level. Without these conditions, the candle may still be interesting, but it is less useful for decision-making.
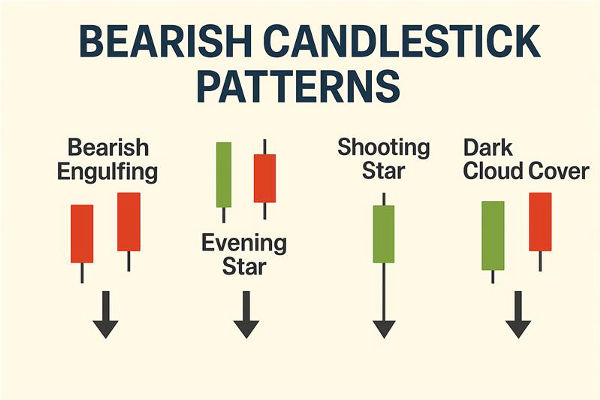
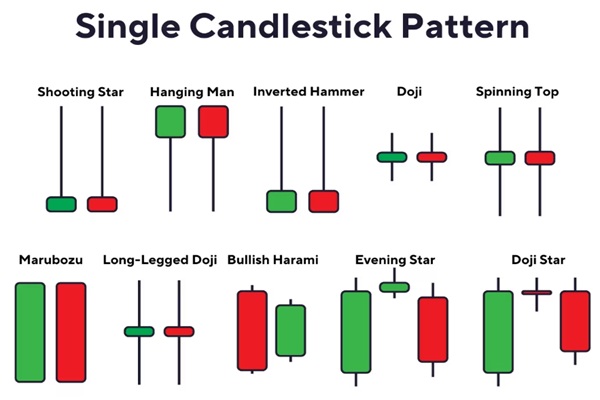
The shooting star is often confused with other candlestick patterns because it resembles several candles with small bodies and long shadows. The difference usually comes from the wick direction and the candle's position within the trend.
A shooting star has a long upper wick and appears after an upward move. It warns that buyers failed to hold higher prices.
A hanging man appears after an upward move too, but its long wick is below the body. It shows that sellers pushed price lower during the session, even though the close recovered.
An inverted hammer resembles a shooting star and forms after a decline. Because the market context is different, traders may read it as a possible bullish reversal signal rather than a bearish one.
A gravestone doji also has a long upper wick, but the real body is almost nonexistent because the open and close are very close together. It can also show rejection near resistance, but it reflects stronger indecision at the close.
The safest way to avoid confusion is to start with trend location. After a rally, a long upper wick can be a shooting star. After a decline, the same shape may not carry the same bearish meaning.
A shooting star is bearish when it forms after an uptrend or upward swing. It shows that buyers pushed price higher but failed to keep control by the close.
No. A shooting star does not guarantee a price decline. It becomes more useful when it appears near resistance and is followed by bearish confirmation.
No. A red shooting star may look more bearish, but a green shooting star can still show rejection if it forms after a rally and closes near the lower part of the candle.
A lower close after the shooting star, rejection at resistance, higher volume, RSI divergence, or weakening MACD momentum can help confirm the bearish signal.
They look similar but appear in different locations. A shooting star forms after an advance and warns of bearish reversal risk. An inverted hammer forms after a decline and may suggest bullish reversal potential.
The shooting star candlestick pattern helps traders recognise when an upward move may be losing strength. The long upper wick indicates failed buying pressure, while the small body near the low suggests sellers gained strength before the close.
The pattern works best when it appears after a rally, near resistance, and with bearish follow-through. The wick high is the key invalidation level. If price moves above it, the rejection has likely failed. If price stays below it and continues lower, the shooting star becomes a stronger warning that buyers have lost control.