Published on: 2025-05-15
Updated on: 2026-08-13
A gravestone doji is a single candlestick with a long upper shadow and almost no body. The open, the close, and the low all sit near the same price, so the candle looks like an upside-down letter T. It forms when buyers lift price during a session, and sellers push it all the way back by the close. After a sustained rise, it warns that the advance may be running out of buyers. On its own, it confirms nothing.
Most guides stop at the shape. The harder questions are where the candle matters and how often it works, and independent research answers both more honestly than trading folklore does.
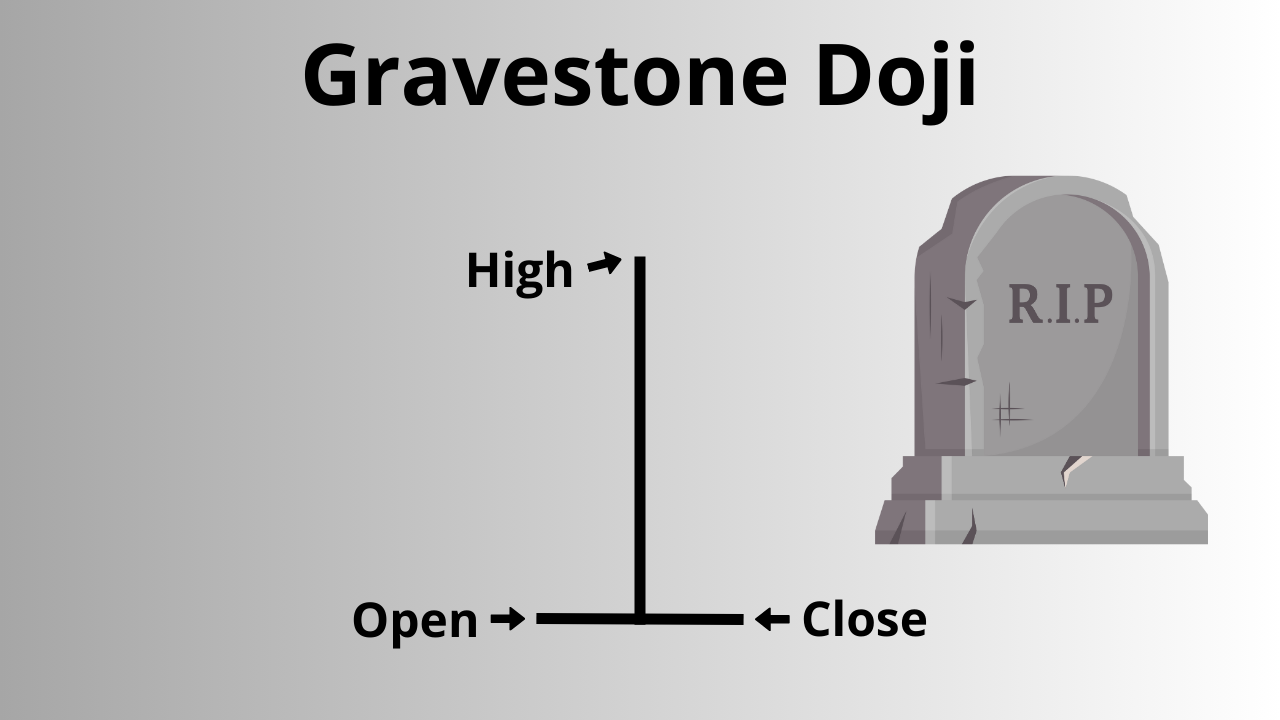
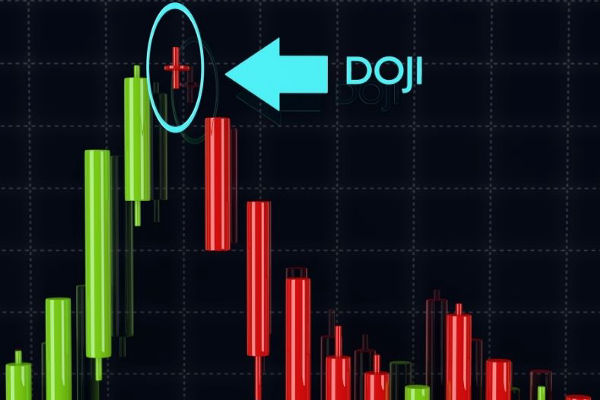
The gravestone belongs to the family of doji candles, candles whose open and close finish at almost the same level. The gravestone version follows one sequence. Price opens, buyers drive it well above the opening level, then sellers absorb the advance and force it back down. By the close, the session’s entire gain is gone, and price sits near its low.
The long upper shadow records that failed advance. The missing body records the stalemate: after all that movement, neither side kept an edge.
In live markets, the open, close, and low are rarely identical to the tick. A small lower wick, or a one-tick gap between open and close, still counts. The defining features are the long upper shadow and a close near the low of the candle.
The gravestone doji is a bearish signal. It shows that buyers controlled part of the session and lost that control by the close, and after a rise, it puts the trend in question. Location decides how much weight it deserves.
Candle colour changes little. Because the open and close are nearly equal, a gravestone doji can print green or red without altering the reading. The shape and the location carry the information.
The candle can print in any market and on any timeframe. Its meaning shifts with each.
Chart location comes first.
At the top of an uptrend or at a resistance level: the strongest version. Buyers failed at a price that already mattered.
Inside a sideways range: usually short-term resistance, a pause rather than a turn.
During a downtrend: weak and ambiguous, often read as hesitation before the decline resumes.
Timeframe changes the weight. Daily and weekly gravestone dojis reflect the decisions of more participants across a longer window, so they carry more authority than one-minute or five-minute versions, where random noise dominates.
The market shapes the candle too. Stock sessions can open with a gap, which makes a gravestone doji after an earnings release stand out sharply. Forex trades around the clock, and the daily candle depends on the platform’s server close, so clean gaps are rarer, and the candle is usually read against session behaviour. In gold, long upper wicks tend to cluster around US data releases and moves in the dollar.
Gravestone doji |
Dragonfly doji |
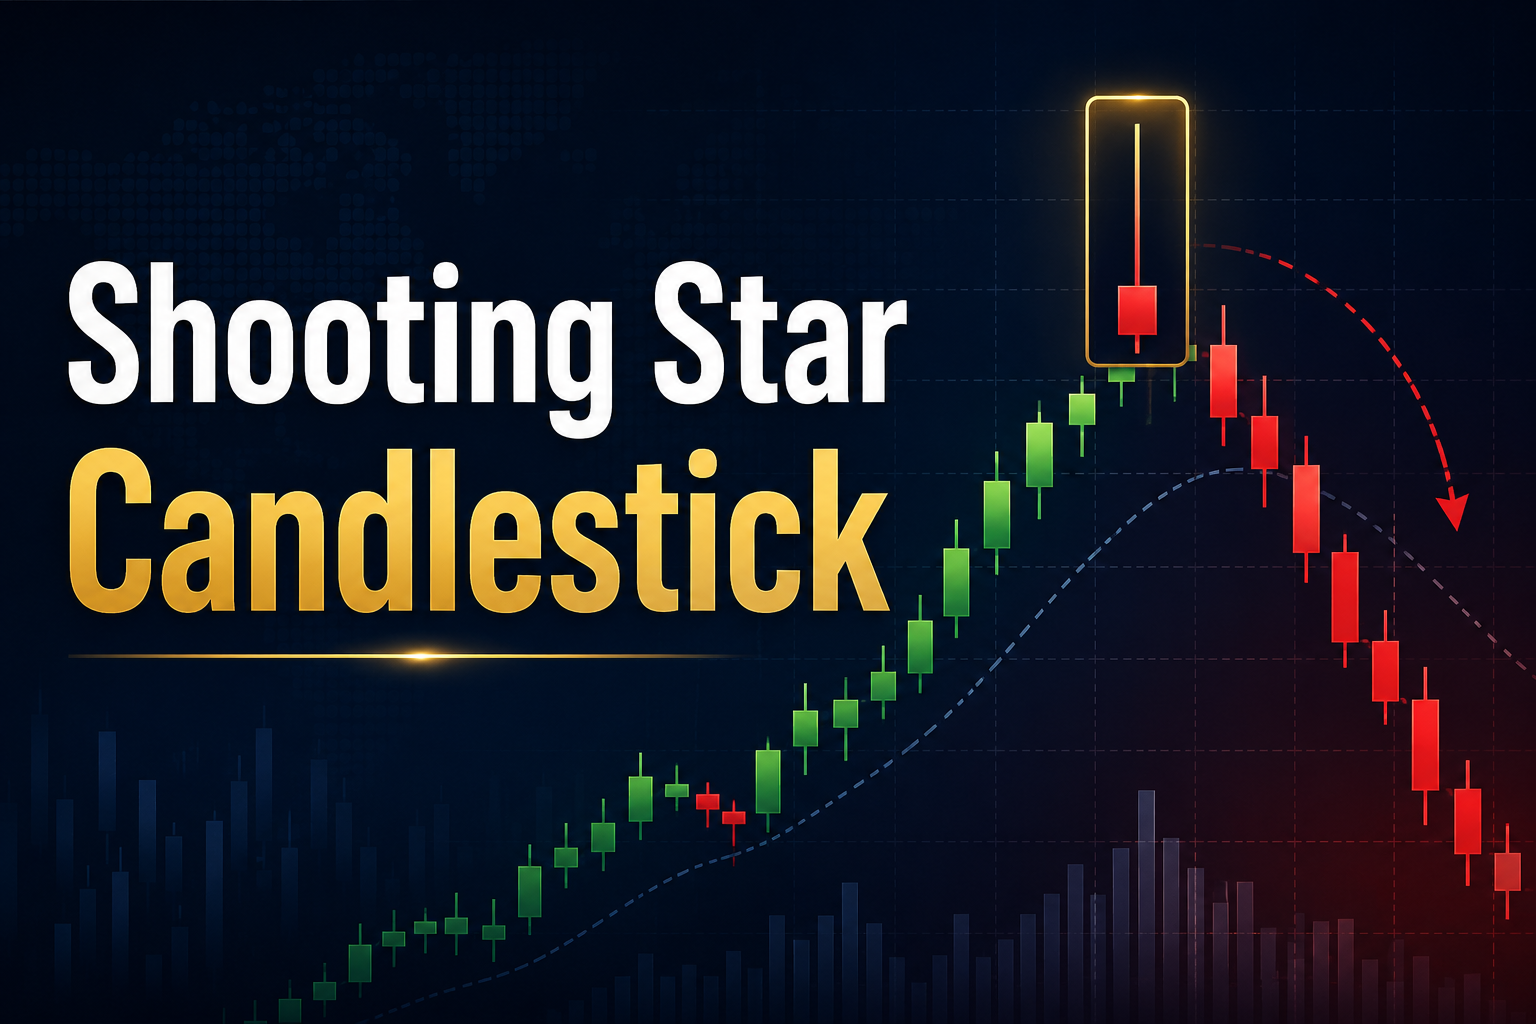
Shooting star |
|
Real body None (open equals close) |
Real body None (open equals close) |
Real body Small, near the low |
|
Upper shadow Long |
Upper shadow None or tiny |
Upper shadow Long |
|
Lower shadow None or tiny |
Lower shadow Long |
Lower shadow None or tiny |
|
Usual location Top of an uptrend or at resistance |
Usual location Bottom of a downtrend or at support |
Usual location Top of an uptrend |
|
Bias Bearish |
Bias Bullish |
Bias Bearish |
The gravestone doji and the shooting star are the pair most often confused, and the body is the tiebreaker: the shooting star keeps a small one, the gravestone has none. All three sit inside the wider set of candlestick pattern types.
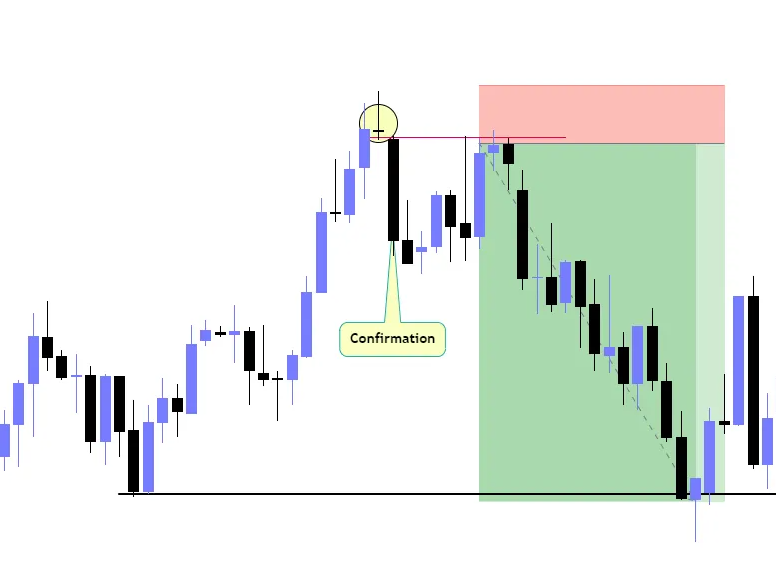
Formal tests show the candle fails often on its own, so the standard method builds a sequence around it rather than acting on the single bar.
Traders wait for confirmation. The setup only counts once a later candle closes below the doji's low, proof that sellers followed through.
The invalidation point sits above the upper shadow. A close back through the high means buyers reclaimed the rejected ground, and the setup is dropped.
The protective stop goes with the invalidation, just above the high of the doji, because that is the price sellers defended.
The first target is usually structural: the nearest support level or prior swing low. The distance to it, weighed against the stop distance, gives the risk-reward ratio.
A worked example makes the arithmetic clear:
Suppose gold prints a daily gravestone doji with a high of 2,415 and a low of 2,398 after a two-week advance. The next day closes at 2,396, below the doji’s low, which confirms the setup. A sell position opened near that close carries a stop above 2,415, a risk of roughly $19 per ounce. If the nearest support sits at 2,360, the first target offers about $36, close to a 1:2 risk-reward ratio.
A later daily close back above 2,415 ends the trade idea regardless of anything else on the chart. Because the pattern fails often, position size follows from the stop distance, so a losing signal costs a known and limited amount.
Two filters separate stronger setups from weaker ones.
Volume gives the rejection weight: a gravestone doji printed on above-average volume shows heavy participation in the failure, while a quiet one may only reflect a thin session.
Momentum adds context: some traders check the Relative Strength Index (RSI), a gauge that runs from 0 to 100, and give the pattern more credit when the advance into it was already stretched. Multi-candle relatives such as the evening star tell the same top-of-trend story across three sessions, and the wider library of chart patterns shows where this setup fits.
Bearish, with the strongest reading at the top of an uptrend or at a resistance level. In a downtrend, the signal is weak and often set aside.
Academic tests are sceptical. A 2017 study in SAGE Open found the expected decline followed the pattern less often than a coin toss on the Stock Exchange of Thailand, and studies in the Journal of Banking and Finance (2006) and the Quarterly Review of Economics and Finance (2009) found no value in candlestick strategies on US stocks. This is why standard practice waits for confirmation before acting on the candle alone.
They are mirror images. The gravestone has a long upper shadow and shows sellers rejecting higher prices. The dragonfly has a long lower shadow, shows buyers rejecting lower prices, and carries a bullish bias at bottoms.
Both show rejected higher prices at the top of a rise. The shooting star keeps a small real body because its open and close differ. The gravestone doji closes back at its open, leaving no body.
Very little. The open and close sit so close together that a green or red print changes nothing about the reading. The upper shadow and the closing position define the candle.
No single candle has earned that trust in formal testing, and the gravestone doji is no exception. Its durable value is the information it leaves on the chart: the exact price where buying failed. Everything useful about the pattern flows from that reference point, from the confirmation rule to the stop placement, and it stays relevant for as long as the market keeps trading around it. The candle starts the analysis. The levels it marks are what finish it.
Disclaimer: This material is for general information purposes only and is not intended as (and should not be considered to be) financial, investment or other advice on which reliance should be placed. No opinion given in the material constitutes a recommendation by EBC or the author that any particular investment, security, transaction or investment strategy is suitable for any specific person.