Published on: 2025-06-26
Updated on: 2026-04-07
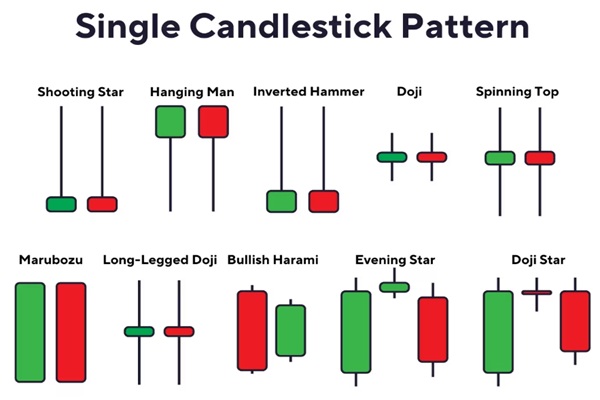
A single candlestick pattern can reveal a sharp shift in market sentiment within one bar. In this article, the focus is on five practical reversal and indecision setups: the hammer, hanging man, shooting star, inverted hammer, and spinning top.
Recognising a single candlestick pattern in real time can help traders read the balance between buyers and sellers more clearly.
For traders focused on clean, price-action-based strategies, these one-bar patterns are best used with trend context and confirmation from the next candle.

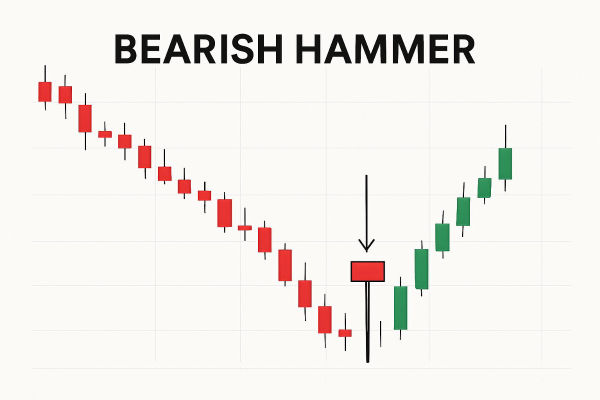
The hammer is a classic single candlestick pattern that signals a potential bullish reversal. It has a small real body near the top of the trading range and a long lower shadow, typically at least twice the height of the body. The upper shadow is either very small or non-existent.
What It Tells You:
The hammer indicates that, although sellers initially drove prices lower during the session, buyers regained control by the close, pushing the price back up. This shift in momentum suggests potential exhaustion of the downtrend and a possible bullish reversal.
Confirmation Tip:
Wait for a bullish candle to close above the hammer's high on the next session. Volume spikes can also support the signal's strength.
Example Context:
Imagine gold prices trending down for several days. A hammer forms with a long wick into a historical support level, which can signal that sellers are losing control and buyers are stepping in.
 Visually identical to the hammer, the hanging man forms at the end of an uptrend. It features a small body at the top and a long lower shadow, indicating a failed attempt by buyers to sustain bullish momentum.
What It Tells You:
Although bulls managed to push prices higher, strong intraday selling pressure emerged. If followed by a bearish candle, this pattern warns that buyers may be losing strength, and a reversal to the downside could follow.
Common Mistake:
Traders often confuse the hanging man with a hammer—context matters. A hanging man only carries bearish implications when it appears after a significant rally.
Confirmation Tip:
Look for increased volume on the hanging man candle, and a break below its low on the following session for confirmation.

The shooting star is another potent single candlestick pattern that forms after an uptrend. It features a small real body near the low of the session, with a long upper shadow, usually at least twice the height of the body. The candle often opens near the day's low, rallies sharply, and then falls back toward the open by the close.
What It Tells You:
This pattern signals that buyers initially drove the market higher, but sellers later overwhelmed the bulls, forcing prices down. The failure to maintain the highs suggests that bullish momentum is fading.
Confirmation Tip:
The signal strengthens if the next candle is a large bearish body closing below the shooting star's low, ideally on increased volume.
Common Use:
Shooting stars often appear in equity markets or commodities like oil after sharp rallies, especially near resistance levels or overbought RSI readings. When the pattern appears at a clear resistance area and momentum is stretched, the reversal signal becomes more credible.

The inverted hammer is a bullish single candlestick pattern that occurs after a downtrend. It resembles an upside-down hammer, with a small body near the low of the session and a long upper shadow that shows buyers were able to test higher prices.
What It Tells You:
Although the market opened lower and rallied during the session, it could not hold the gains. However, the attempt by buyers to push prices up indicates a potential shift in momentum, suggesting that bears may be losing control.
Confirmation Tip:
A bullish candle closing above the inverted hammer's high on the following day is vital to validate this signal. Volume confirmation is also recommended.
Psychological Insight:
The pattern shows battling sentiment—bears still have control, but bulls are starting to fight back, making it a potential early reversal indicator.
 The spinning top features a small real body, showing limited distance between the open and close, and upper and lower shadows of similar length. It can appear in either an uptrend or a downtrend, but its meaning depends heavily on what came before it.
What It Tells You:
A spinning top reflects market indecision, with neither buyers nor sellers able to dominate. It is better treated as a warning sign than a reversal signal on its own. After a strong move, it can signal that momentum is fading and that traders should wait for confirmation.
Confirmation Tip:
Traders often wait for the next candle to determine whether momentum continues or reverses. For instance, a bearish candle following a spinning top after a rally may confirm a trend shift.
Key Insight:
The spinning top doesn't scream reversal like a hammer or shooting star—but when it shows up at major support/resistance levels, it often foreshadows a bigger move.
Single candlestick patterns can provide useful clues about market sentiment and potential turning points. The hammer, hanging man, shooting star, and inverted hammer are especially useful for identifying possible trend reversals, while the spinning top is better treated as an indecision signal that needs confirmation.
All five patterns become more reliable when combined with volume, context, and follow-through candles.
Traders who learn to interpret these patterns within the broader context of market structure and trend direction gain a valuable edge. While no candlestick should be used in isolation, these single-bar signals are essential building blocks in a trader's technical analysis toolkit.
By mastering these key patterns and their psychological underpinnings, traders are better equipped to anticipate shifts in momentum and improve their decision-making at critical market junctures.
Disclaimer: This material is for general information purposes only and is not intended as (and should not be considered to be) financial, investment or other advice on which reliance should be placed. No opinion given in the material constitutes a recommendation by EBC or the author that any particular investment, security, transaction or investment strategy is suitable for any specific person.