When trading in the financial markets, understanding the relationship between supply and demand is crucial, as it determines price formation and market functionality. Many newcomers rely on various technical indicators and Chart Patterns, hoping to find reliable Trading signals. However, true professionals delve deeper, using market depth analysis to gain insights into market behavior and the genuine dynamics of supply and demand. Let's explore market depth analysis in detail and learn how it helps avoid poor trading decisions based on superficial information.
What is Market Depth?
Market depth refers to the aggregation of buy and sell orders along with their corresponding price levels, visible on live trading platforms. This concept is crucial in financial markets as it assesses the market's capacity to handle large trades without causing significant price fluctuations in an asset.
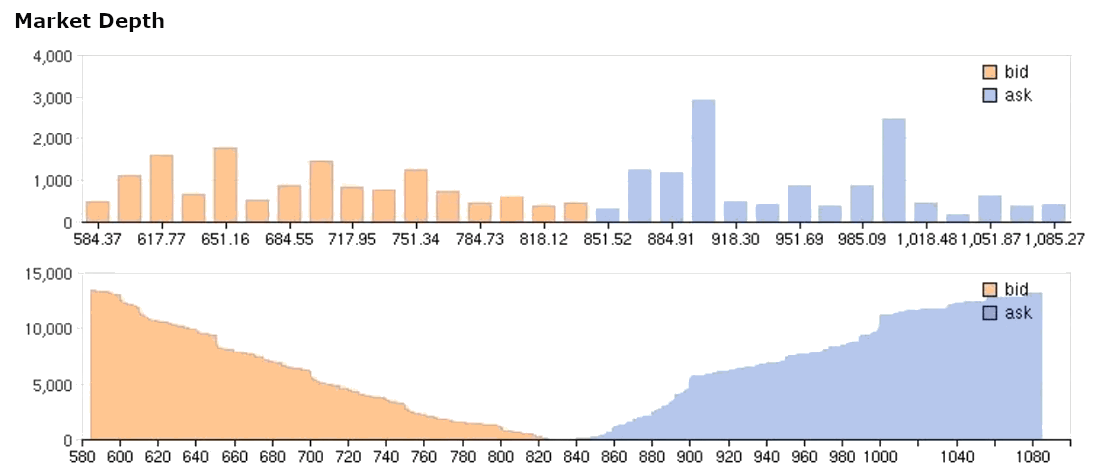
Market depth is typically represented through an order book or depth chart, providing traders with real-time insights into current supply and demand dynamics. This data illustrates the willingness of market participants to transact at specific prices and quantities, thereby reflecting market liquidity and stability. As a fundamental indicator, market depth plays a pivotal role in evaluating overall market health.
The two components of market depth are buying depth and selling depth. Buying depth, depicted by decreasing prices and increasing quantities, represents the volume of assets buyers are willing to purchase at given prices. Conversely, selling depth, shown by increasing prices and quantities, denotes the amount of assets sellers are willing to sell at specific prices.
The depth of bids in a market indicates the level of demand and support for an asset at specific price points. Deeper bid depth suggests strong buying interest near the price, potentially forming a support level. Conversely, shallower bid depth may create resistance to price increases.
On the other hand, selling depth reflects the supply of assets available for sale above a given price level. A deeper sell depth implies significant supply pressure, potentially acting as a resistance level. Conversely, shallower sell depth may support price declines.
Market depth is a crucial indicator of liquidity, illustrating the active trading and availability of assets. A deep market depth, characterized by numerous buy and sell orders near the current price, signifies a liquid market. This depth allows for large trades with minimal impact on asset prices.
In essence, greater market depth enhances liquidity, lowers transaction costs, and facilitates easier buying and selling of assets.
Analyzing market depth allows traders to predict support and resistance levels for market prices. When buying depth (number of buy orders) exceeds selling depth (number of sell orders), it indicates strong demand at current prices, potentially driving prices higher. Conversely, higher selling depth suggests more supply than demand, putting downward pressure on prices or hindering upward movement.
Market depth data is typically shown via order books, enhancing market transparency by detailing specific price levels and quantities available for trading. This clarity enables traders to develop precise strategies, manage risks effectively, and determine optimal entry and exit points based on supply and demand dynamics.
Traders utilize market depth analysis to refine their strategies by evaluating order books or depth charts. This allows them to select optimal buy or sell prices and accurately assess market conditions to minimize risks associated with price fluctuations and slippage.
Overall, market depth serves as a critical gauge of financial market liquidity and stability. By assessing market health and transaction costs, traders can make informed decisions and strategic investments that align with their objectives.
Understanding Market Depth in Trading
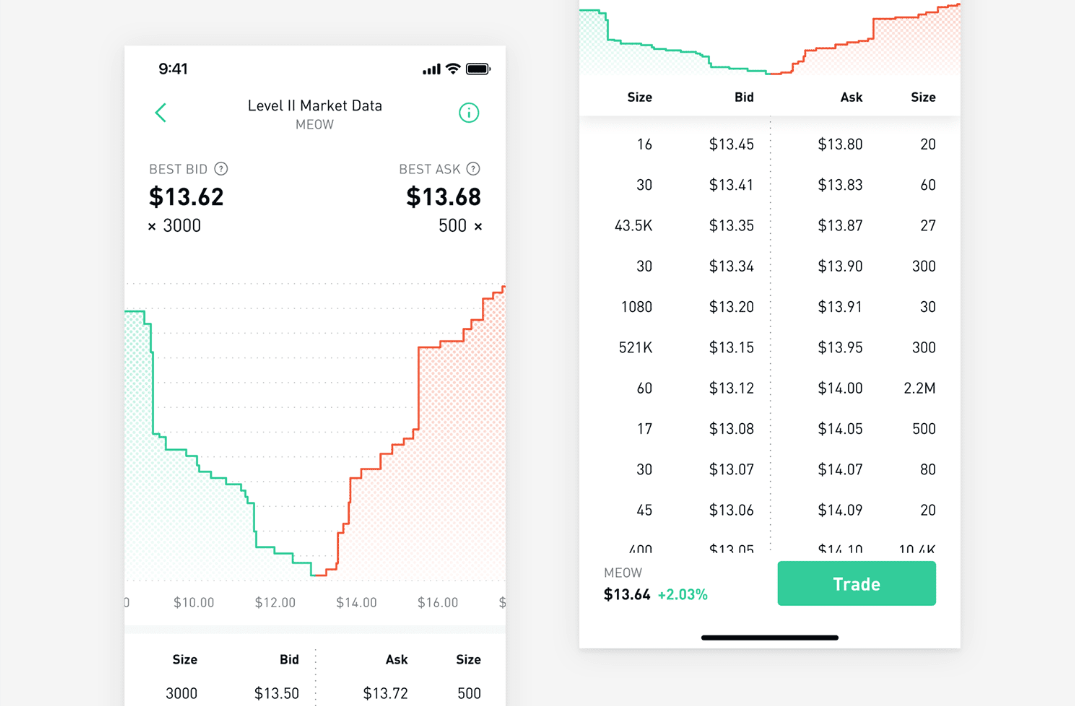
Market depth is a crucial financial tool provided through order books or depth charts on trading platforms. These tools visualize buy and sell orders at various price levels, enabling traders to assess market supply, demand, and price movements effectively.
The order book typically appears as a table on trading platforms, listing buy orders from highest to lowest price on the left and sell orders from lowest to highest on the right. This format offers a clear view of order quantities at different price levels, reflecting market dynamics.
Depth charts complement order books by presenting market information graphically. They divide into upper and lower halves: the upper half illustrates sell depth (sellers' orders), and the lower half shows buy depth (buyers' orders). These charts use color-coded bars or shaded areas to represent order volumes at each price level.
Analyzing depth charts helps traders identify support and resistance levels near the current market price. These insights are crucial for developing effective trading strategies and managing risks. For instance, traders can use buy depth to anticipate price increases or sell depth to avoid potential declines.
Real-time market depth is essential as it continuously updates with market conditions and trader activities. Traders monitor these charts closely to adjust strategies promptly, enhancing decision-making accuracy and trading efficiency.
In conclusion, leveraging market depth tools empowers traders to navigate dynamic market conditions effectively, optimize trade timing, and improve overall trading outcomes.
Market Depth Trading
This refers to the way traders use market-depth information (such as buy and sell orders in the order book) to optimize their trading strategies, which mainly includes pending order tracking, slippage trading, liquidity provision, iceberg orders, instantaneous arbitrage, and so on. It can help traders formulate and execute trading strategies more effectively to cope with different market conditions and volatility.
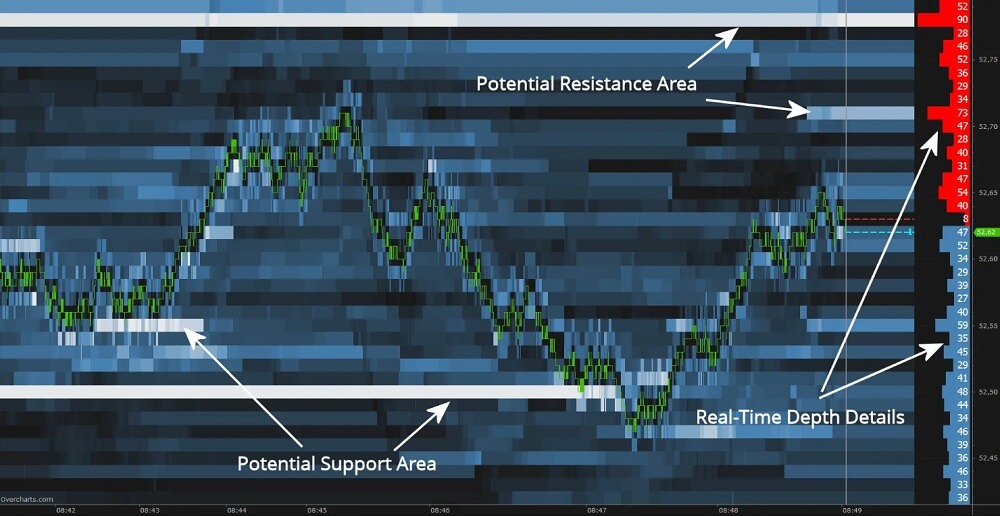
Among them, Pending Order Tracking (Order Book Monitoring) is an important method for traders to assess buying and selling pressure and market sentiment by monitoring the number and changes of pending orders in the order book. This method includes monitoring large orders and their cancellations, which helps traders more accurately grasp the supply and demand situation and price movements in the market and effectively formulate trading strategies and risk management plans, thus improving the accuracy and efficiency of trading decisions.
Large order tracking refers to the monitoring of large buy or sell orders that appear in the order book. These large orders usually have significant market influence and can directly affect market price movements. By tracking these large orders, traders are able to better understand the actual demand for trading in the market and the direction of capital flows, which helps them make appropriate trading decisions.
Withdrawals of pending orders can reflect changes in market participants' sentiment and market dynamics. The withdrawal of large orders may indicate that market participants views on a particular price or market direction have changed; this change may affect the market's short-term price movements and long-term market trends.
Slippage trading is the difference between the actual execution price and the expected price in a trade. Traders use the depth of market information to minimize the impact of slippage, thereby reducing transaction costs and improving the efficiency and success of trade execution.
This is done by first analyzing the number of buy-and-sell orders in the order book to estimate the potential slippage costs of large trades. In order to minimize the impact of slippage, large trades are then broken down into multiple smaller trades. This diversified trading volume strategy can reduce the impact of a single transaction on the market price, reduce the probability of slippage and the degree of impact, and thus optimize the implementation of trading strategies.
Liquidity provision refers to a number of traders in the market who provide buyers and sellers with orders to earn the difference between the bid and ask price. These traders play a key role in the market, not only to help ensure that the market operates efficiently but also to earn profits through the bid-ask spread. This strategy requires traders to have sensitivity to market depth and price movements in order to adjust their liquidity provision strategy in a timely manner and maintain flexibility and agility in a changing market environment.
Using a limit-order pending order strategy is a common approach to liquidity provision. Traders will place a pending order between the bid and ask prices in the order book at the same time, which not only provides needed liquidity to the market but also allows the trader to profit from the bid and ask spreads.
Alternatively, some traders employ a market-neutral strategy, which means that they simultaneously buy and sell the underlying asset in order to hedge against market risk. This approach usually involves hedging the underlying securities or related financial instruments, thereby reducing the impact of market volatility on their asset portfolios and helping to maintain relatively stable returns and risk management.
Iceberg orders, on the other hand, are a strategy that reduces significant price fluctuations in the market by splitting large orders into smaller ones that are gradually released into the market. The key is to hide the actual size of the order and show only a portion of the order size to prevent other market participants from realizing that a large trade is in progress. At the same time, iceberg orders help traders effectively manage market risk and maintain market stability by executing large trades in batches, with each small order execution having less of an impact on the market.
Instant arbitrage is an arbitrage strategy that capitalizes on price differences between different exchanges to buy and sell quickly. By analyzing in-depth market information, traders can quickly execute buys and sells of the same asset across different exchanges to gain arbitrage opportunities. This strategy relies on high-frequency trading techniques to capture and exploit market price differences with very low latency, thereby maximizing profits and reducing risk.
Moreover, deep market trading relies on advanced tools and technical support. Algorithmic and high-frequency trading systems utilize automated algorithms that perform complex analysis and trades and low-latency execution strategies that quickly respond to market changes in microseconds to take advantage of instantaneous price differences. These technologies not only increase the speed and accuracy of trading but also enable the efficient use of information to design more complex and sophisticated trading strategies.
However, it also requires traders to possess a high level of technical ability and deep market understanding. Such capabilities enable them to effectively deal with fast-moving and high-risk market environments, and they need to be equipped with effective risk management strategies to protect their investments. Successful implementation of these trading strategies therefore relies not only on the application of technical tools but also requires traders to remain flexible and agile in the face of market challenges.
While these market-depth trading strategies bring many advantages, they also come with some risks and challenges. The first is the impact of market volatility, especially during periods of high volatility when information can change rapidly, increasing the difficulty and risk of trading decisions. Second, large orders may trigger slippage, where the actual transaction price deviates from the expected price, which may also lead to higher transaction costs and challenge traders' profitability.
Finally, high-frequency trading systems and algorithmic trading are exposed to the risk of technical failures and execution errors. This risk can lead to interrupted or inaccurate execution of trades, which can affect the efficiency of a trader's operations and the final outcome of a trade. Therefore, effective risk management and technical support are critical to the successful implementation of trading strategies.
In summary, depth-of-market trading helps traders better understand market dynamics, optimize trading strategies, and reduce trading costs by utilizing information from order books and depth charts. Despite the high risk and complexity associated with this type of trading, for skilled traders, this trading strategy can provide significant advantages and profit opportunities.
Analysis of market depth and its application
| Category |
Definition. |
Applications |
| Market Depth |
Market's capacity for large trades |
Assess liquidity and develop trading strategies |
| Buy Depth |
Total number of buy orders |
Predict price rises based on support levels |
| Sell Depth |
Total number of sell orders |
Predict price declines based on resistance levels |
| Order Book |
Displaying buy and sell orders with prices. |
Time trades based on supply and demand |
| Depth trading |
Using market depth for trading strategies. |
Enhance trade efficiency, cut transaction costs |
Disclaimer: This material is for general information purposes only and is not intended as (and should not be considered to be) financial, investment, or other advice on which reliance should be placed. No opinion given in the material constitutes a recommendation by EBC or the author that any particular investment, security, transaction, or investment strategy is suitable for any specific person.


