Published on: 2025-04-21
Updated on: 2025-10-14
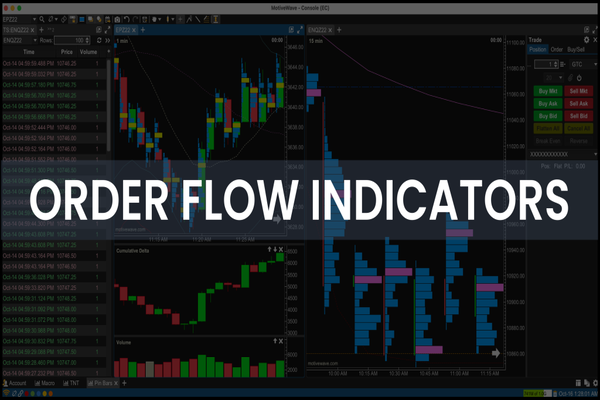
Instead of relying on lagging technical indicators, it displays actual market activity and shows where orders are being placed, filled, or canceled across various price levels.
In today's fast-paced financial markets, understanding the real-time intentions of buyers and sellers is crucial for making informed trading decisions.
The Order Flow Indicator has become an essential tool for traders seeking to gain an edge by analysing the actual flow of buy and sell orders, rather than relying solely on historical price data.

An Order Flow Indicator is a trading tool that visualises how buy and sell orders are distributed across various price levels in the market.
Unlike traditional technical indicators, which often lag behind price action, Order Flow Indicators give traders real-time trading data of market sentiment by showing the depth, breadth, and speed of orders as they enter the market.
This transparency helps traders identify who is in control of the market at a given moment, buyers or sellers, and how aggressively they’re pushing price levels.
It also highlights where large orders are sitting, which often act as magnets for price or as hidden barriers that define short-term support and resistance zones.
This immediate feedback enables traders to see not just where prices are moving, but how and why they are moving, offering insight into the underlying market structure.

Order flow analysis focuses on the interaction between buy and sell orders in the market's order book like a real-time ledger displaying all active orders at different price points.
When a trader places an order, it is added to the order book and may be matched with an opposing order, resulting in a trade.
The balance between buy and sell orders at each level reveals the current supply and demand, which directly influences price movements.
Large orders, particularly from institutional traders, can create significant imbalances in the order book, leading to sharp moves in price.
By monitoring these imbalances, traders can identify areas of strong support and resistance, as well as anticipate potential breakouts or reversals.
Price movement is the visible outcome of order flow imbalance. When aggressive buy orders overpower sell liquidity, the market has no choice but to move higher.
Similarly, an excess of sell orders drives prices down.
These imbalances often precede price changes rather than follow them. For example:
A buildup of buy orders just below support suggests institutional accumulation.
A sudden drop in bids near resistance may hint at fading demand.
Recognizing these shifts in real time gives traders the ability to anticipate reversals, breakouts, or momentum continuations before the crowd reacts.
There are several types of Order Flow Indicators, each offering unique insights into market activity:
| Indicator Type | Purpose | Key Insights |
|---|---|---|
| Volume Profile | Displays traded volume at each price level. | Identifies value areas, support/resistance, and balance zones. |
| Depth of Market (DOM) | Shows pending buy/sell orders at various price points. | Reveals liquidity pockets and market thickness. |
| Footprint Chart | Plots executed trades per price level with volume and delta data. | Exposes real buying/selling pressure and absorption points. |
| VWAP (Volume Weighted Average Price) | Calculates average price weighted by volume. | Benchmarks institutional activity and fair value zones. |
Each serves a different purpose, but when combined, they build a complete view of where liquidity enters and exits the market for an invaluable perspective for day traders and professionals alike.
1. Real-Time Trading Data
Order Flow Indicators provide up-to-the-minute data on market sentiment, allowing traders to react quickly to changes in buying and selling pressure.
This is especially valuable in volatile markets, where conditions can shift rapidly.
2. Improved Decision-Making
By analysing the distribution of orders and executed trades, traders can make more informed decisions about entry and exit points.
For example, spotting a large cluster of buy orders just below the current price may signal strong support, while a buildup of sell orders above could indicate resistance.
3. Enhanced Risk Management
Order Flow Indicators help traders manage risk by revealing hidden order imbalances that could lead to sudden price movements.
By anticipating these moves, traders can adjust their stop-loss and take-profit levels more effectively.
4. Precision for Short-Term Traders
Scalpers and day traders benefit greatly from Order Flow Indicators, as they provide the precision needed for fast, short-term trades.
By tracking real-time changes in order flow, these traders can enter and exit positions at optimal moments.
Order flow shouldn’t replace all other forms of analysis, instead it should enhance them. Many professional traders pair order flow data with:
Chart patterns to confirm breakouts or fakeouts.
Volume analysis to gauge strength behind moves.
Sentiment indicators to measure broader market positioning.
For instance, if a bullish chart setup coincides with rising buy pressure on the order book, the probability of follow-through increases significantly.
Imagine a trader monitoring the order book for a major currency pair. They notice a significant buildup of buy orders at a key support level.
As the price approaches this level, the Order Flow Indicator shows an increase in buying pressure. The trader enters a long position, anticipating that the support will hold and the price will bounce.
Conversely, if a large block of sell orders appears at resistance, the trader may decide to take profits or enter a short trade.
No tools are perfect and it is normal to come with limitations. For the order flow indicator, it’s limitations are:
Complexity: Interpreting order flow requires practice and familiarity with order book dynamics.
Platform Requirements: Access to real-time order flow data often requires advanced trading platforms.
Short-Term Focus: Order flow analysis is best suited to short-term trading and may be less useful for long-term investors.
Start with demo accounts to practise interpreting order flow before trading live.
Combine order flow with chart analysis for more reliable signals.
Adjust your strategy based on market volatility and liquidity conditions.
Remain disciplined and avoid overreacting to short-term fluctuations.
The Order Flow Indicator displays real-time buying and selling activity in the market, showing where large orders are placed, filled, or canceled. It helps traders identify which side, buyers or sellers, is controlling momentum.
It can be complex for new traders. Beginners should start with demo accounts to understand how order books and trade imbalances work before using it in live trading.
Order flow analysis is widely used in forex, commodities like gold (XAUUSD), indices, and futures, essentially any market with transparent order book data.
The Order Flow Indicator offers a direct window into real-time market sentiment showing not just what price is doing, but why it’s doing it. For active traders, this insight is invaluable.
By reading live supply-demand imbalances and tracking where liquidity is entering or leaving, traders gain a decisive edge in anticipating short-term movements.
Used correctly, order flow transforms trading from reactive guesswork into informed decision-making, a skill every serious trader needs in today’s algorithm-driven markets.
Disclaimer: This material is for general information purposes only and is not intended as (and should not be considered to be) financial, investment or other advice on which reliance should be placed. No opinion given in the material constitutes a recommendation by EBC or the author that any particular investment, security, transaction or investment strategy is suitable for any specific person.