Published on: 2025-06-12
Updated on: 2025-06-12
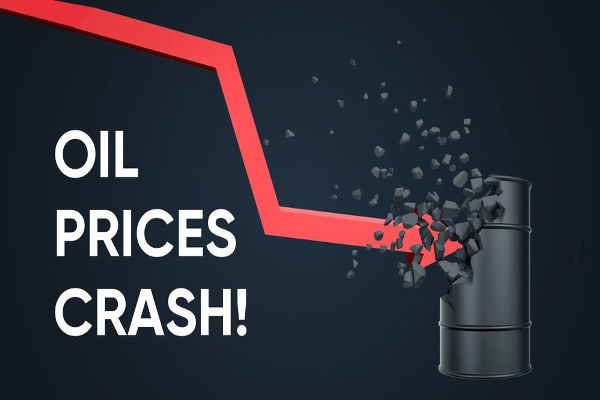
Oil prices have a long history of dramatic swings, with boom and bust cycles that reshape economies and markets. From the 1970s energy crises to the recent 2025 downturn, crashes have been triggered by demand shocks, geopolitical conflict, oversupply, and macroeconomic dislocation.
This guide examines five significant oil downturns, offering a closer look at the situation in 2025 and its comparison to historical events.

What's Happening
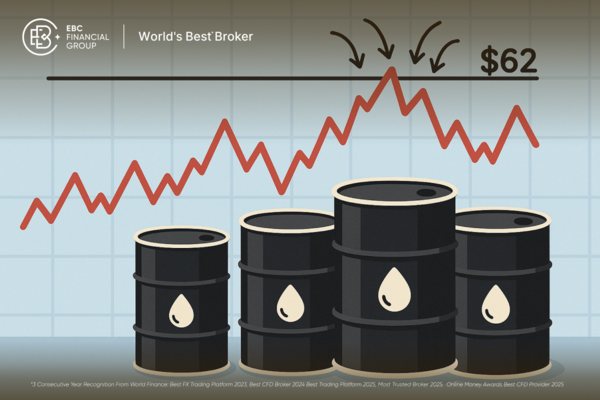
By April 2025, Brent crude slid to roughly 65 USD, driven by OPEC+ supply increases, stagnant demand from the global economic slowdown, and geopolitical noise. In May, weak Chinese demand and rising inventories pressured oil lower.
Today, Brent and WTI hover in the high‑60s, with futures markets in contango.
Fan-Out Drivers
Supply Surge: OPEC+ and non‑OPEC production drove global supply gains of 1.6 mb/d in 2025, with an extra 0.97 mb/d expected in 2026.
Stalled Demand: Oil demand growth slowed to ~650 kb/d—its lowest since the early 2000s.
U.S. & EIA Outlook: U.S. crude output is expected to shrink after 2Q 2026, but inventories will build and pressure prices.
Futures Curve: Markets are in contango—a bearish signal that futures prices exceed spot, encouraging storage.
| Crash | Trigger | Price Change | Duration & Recovery |
|---|---|---|---|
| 1973, 1979-80 | OPEC embargo, revolution | +→ –; ~60% drop | Multi-year slump, slow recovery |
| 1986 Oil Glut | Demand fall, oversupply | ~60% drop (27 → 10 USD) | 5–6 year recovery |
| 1990 Gulf War | Geopolitical invasion | +100% spike, then –33% overnight | Reverted in months |
| 2008 Financial Crash | Demand collapse, financial panic | 145 → 32 USD | Recovery over 4–5 years |
| 2020 Pandemic | Price war + lockdown, storage crisis | WTI hit –37 USD | Recovery by late 2020 |
| 2025 Downturn | Demand stall, OPEC+ output increase | Brent near 65 USD (~25% drop) | Ongoing; EIA forecasts $59–$66 range |
1. The 1970s Energy Crises: OPEC and Supply Shocks
Oil Crisis of 1973
The first major modern crash occurred in 1973 when OPEC's embargo caused oil prices to more than quadruple. Yet, within one year, global demand lagged, and alternative fuels began eroding monopoly power, foreshadowing a multi-year descent.
1979–1980 Crisis
Triggering a second supply shock, the Iranian Revolution sent prices soaring. Then, OPEC oversupply and increased non-OPEC output sent oil plummeting from 39 USD down through the mid-1980s.
Key Lesson: Geopolitical price spikes can be reversed by new supply—spot prices collapsed when new production emerged.
2. The 1980s Oil Glut
Following the turmoil of the previous decade, global consumption dropped, and non-OPEC supply rose between 1982 and 1986. Prices fell from over 27 USD to under 10 USD per barrel by 1986. This crash was structural due to demand constraints, efficiency gains, and expanded production capacity.
3. The 1990 Gulf War Shock
The Iraqi invasion of Kuwait triggered another price spike—from 17 to 36 USD per barrel in just months. When the conflict was resolved, prices dropped 33% overnight—a classic case of supply-side geopolitical panic quickly reversing.
4. The 2008 Financial Crisis
Oil soared to a record high of ~145 USD in July 2008, driven by booming global demand and speculation. However, the subsequent financial crisis triggered a crash to 32 USD by year-end.
Notable Feature: A textbook boom-bust driven by roaring demand followed by dramatic implosion, cutting prices in a few months.
5. The 2020 COVID-19 Price War
In early 2020, saudi arabia and Russia triggered a price war while pandemic lockdowns collapsed demand. WTI briefly fell negative (!) to ‑37 USD in April due to storage shortages. This was unprecedented in history.

Disinflation or Storage Crisis?
Unlike 2020, we don't see storage runs or negative prices—nor are explosive demand drops expected. Yet the oversupply and weak growth echo the 1980s glut, albeit milder.
Broader Forecasts
The EIA expects Brent to average $66 by end-2025 and $59 in 2026, while WTI heads lower. J.P. Morgan backs a similar outlook (~$66/$58), and HSBC adds a warning of surplus into 2026-27. Goldman places a downside scenario under $40 amid recession risks.
Supportive Factors
U.S. output falling from 2026 onward may alleviate supply pressure.
Summer demand and geopolitical flare-ups (Iran‑U.S.) could cushion prices near $70.
Risks
OPEC+ ramping production, especially if it reverses voluntary cuts.
Global economic headwinds and trade tensions further drag demand.
Slow EV adoption dampens oil demand.
Mid-Term Outlook
Projections displayed Brent trending to the $60‑65 range by 2026. The bigger downside of $50-plus is possible in a severe global slowdown
In conclusion, the 2025 oil correction is a classic supply-driven slowdown driven by rapid production growth meeting sluggish demand. While it's not as extreme as the 2020 crash, it reflects echoes of the 1980s oil glut.
With inventories rising and the futures market indicating bearish bias, the EIA and other forecasters expect prices to hang in the mid-$60s to low $60s in 2026.
Disclaimer: This material is for general information purposes only and is not intended as (and should not be considered to be) financial, investment or other advice on which reliance should be placed. No opinion given in the material constitutes a recommendation by EBC or the author that any particular investment, security, transaction or investment strategy is suitable for any specific person.