Currencies are more than numbers on a chart, they are reflections of a nation’s heartbeat. Some currencies mirror growth and productivity, while others move in rhythm with the world’s natural resources. When crude oil prices surge, gold glitters, or iron ore demand rises, certain currencies react almost instantly. These are known as commodity currencies, a class of national currencies whose value is shaped by the export performance of raw materials.
In forex trading, identifying a commodity currency is a skill that separates the reactive trader from the strategic one. It allows a trader to anticipate movements linked to global demand, inflation trends, and supply shocks, rather than simply reacting to chart patterns. Understanding how and why these currencies move can unlock valuable insight into the global economic cycle.
This guide explores what defines a commodity currency, how to identify one through data and behaviour, the major examples that dominate world trade, and how traders can use them to enhance strategy. To build a strong foundation, let's first clarify the core concept behind commodity currencies before moving on to their practical applications, benefits, and risks in today’s changing world economy.
What Is a Commodity Currency?
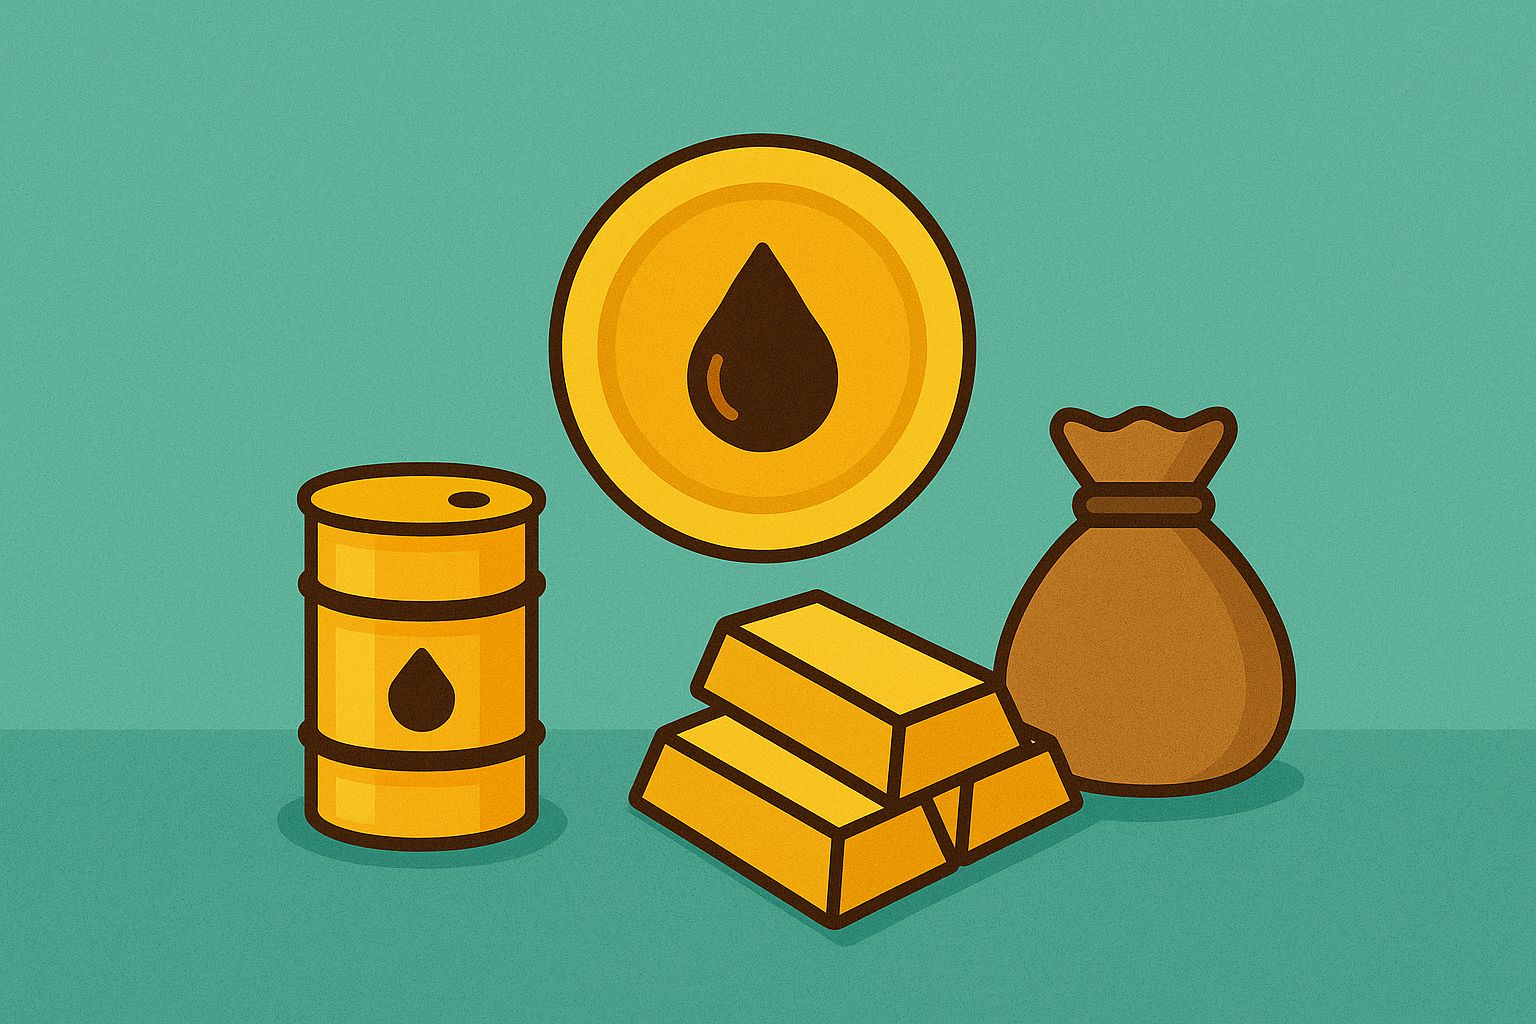
A commodity currency is the currency of a country whose economy depends heavily on the export of raw materials. Its value tends to rise and fall with the prices of key exports such as oil, coal, iron ore, gold, or agricultural products. Because these commodities are traded globally in large volumes, any fluctuation in demand or price directly affects the country’s trade income, and therefore, its currency strength.
When global demand increases and export prices rise, foreign buyers need to purchase more of that country’s currency to pay for goods. This increases demand for the currency and drives appreciation. Conversely, when commodity prices fall, export revenues decline, and the currency tends to weaken.
Examples include:
Australia (iron ore, coal, gold)
Canada (crude oil, energy)
New Zealand (dairy and agriculture)
Norway (Brent crude, gas)
South Africa (metals and minerals)
Each presents a unique resource mix, yet all display a currency tied to key commodities. For forex traders, these currencies directly reveal real-world trade flows and macroeconomic health.
Why Commodity Prices Matter in Forex
Commodity prices influence currencies through several interconnected channels that tie trade, investment, and policy together.
The Trade Balance Effect
Higher commodity prices increase export earnings, improving the country’s trade balance and supporting currency appreciation. For instance, when iron ore prices climb, Australia’s export receipts rise, strengthening the AUD.
Investment and Capital Flows
Strong commodity sectors attract foreign investment into energy, mining, or agriculture. This inflow creates additional demand for the local currency as investors buy assets or fund operations. Canada’s oil-rich provinces have long benefited from such cycles, where rising energy prices draw capital inflows and push the CAD higher.
Interest Rate Dynamics
Higher export revenue can fuel domestic spending and inflation. Central banks in these economies often respond with tighter monetary policy to prevent overheating. Higher interest rates increase the currency’s appeal to yield-seeking investors.
Global Risk Sentiment
Commodity currencies tend to perform well when global growth expectations are strong and risk appetite is high. When markets fear slowdown, investors shift towards safe-haven currencies such as the US dollar or Japanese yen, often causing commodity currencies to weaken.
A striking example occurred between 2020 and 2022. As global economies reopened after the pandemic, demand for oil, metals, and agricultural goods surged. Energy exporters like Canada and Norway saw their currencies strengthen sharply against the dollar, illustrating how commodity recoveries ripple through forex markets.
How to Identify a Commodity Currency
Recognising a commodity currency is not a matter of guesswork. Traders can rely on a systematic process grounded in economic data, correlation studies, and behavioural analysis.
1. Examine Export Composition
If more than half of a nation’s exports are commodities, its currency likely qualifies.
Australia, around 60 percent of exports come from resources such as iron ore, coal, and gold.
Canada, roughly 50 percent from oil, gas, and energy products.
New Zealand, more than 40 percent from dairy, meat, and timber.
These exports shape both the balance of trade and fiscal policy, anchoring the value of their currencies to global demand cycles.
2. Measure Correlation with Commodity Prices
Statistical analysis provides clarity. A commodity currency often maintains a positive correlation (above +0.6) with its main export commodity.
The CAD tends to rise with oil prices.
The AUD shows strong correlation with gold and iron ore.
The NZD tracks global dairy price indices.
By plotting weekly or monthly price data, traders can see whether currency strength aligns with commodity trends.
3. Track the Terms of Trade
The terms of trade, the ratio of export prices to import prices, can signal how favourable global conditions are. A rising ratio indicates improved earnings for exporters, usually leading to currency appreciation.
4. Observe Central Bank Communication
Central banks in resource-dependent nations often discuss commodity cycles in their reports. For example, the Reserve Bank of Australia monitors iron ore prices as part of its inflation outlook, while the Bank of Canada regularly cites crude oil as a key external factor.
5. Watch Behaviour During Global Events
Commodity currencies typically weaken during global downturns when commodity demand falls. Their tendency to amplify global cycles makes them reliable indicators of investor sentiment.
By applying these criteria, traders can verify whether a currency is truly commodity-linked or merely influenced by temporary trade fluctuations.
The World’s Leading Commodity Currencies
Commodity currencies exist across multiple continents, reflecting how global demand for resources connects economies.
Australian Dollar (AUD)
Australia’s exports rely heavily on iron ore, coal, and gold, particularly to China. When industrial activity in Asia accelerates, demand for Australian resources rises, lifting the AUD. Conversely, trade slowdowns or falling metal prices can lead to depreciation. The AUD also benefits from relatively high interest rates compared to other developed economies, which often attract yield-seeking capital during commodity booms.
Canadian Dollar (CAD)
Canada’s economy revolves around crude oil, making the CAD one of the most sensitive currencies to global energy prices. A sustained rise in oil prices strengthens Canada’s fiscal position, often prompting the currency to outperform peers. During 2020’s oil price crash, the CAD tumbled to five-year lows, but as prices rebounded past USD 80 in 2022, the currency regained much of its lost ground.
New Zealand Dollar (NZD)
The NZD is driven by exports of dairy, meat, and timber. Global agricultural demand and weather conditions influence its direction. The currency tends to rise during periods of robust global consumption and fall when commodity markets soften. Seasonal factors, such as crop yields or droughts, can also contribute to volatility.
Norwegian Krone (NOK)
Norway’s economy is built on oil and gas exports, and the NOK moves closely with Brent crude prices. Fiscal prudence and its sovereign wealth fund buffer volatility, but the krone still mirrors energy cycles. When European energy demand rises, the NOK typically appreciates.
South African Rand (ZAR)
The Rand reflects South Africa’s dependence on precious metals such as gold, platinum, and palladium. It is also influenced by global risk sentiment, as investors often treat the ZAR as a proxy for emerging-market performance. This dual exposure makes it both opportunity-rich and volatile.
These currencies reflect their nations’ resource strengths and offer traders insight into how global commodity cycles affect monetary policy and investor psychology.
Analysing a Commodity Currency in Practice
To confirm whether a currency is commodity-linked, traders can combine quantitative analysis with macroeconomic context.
Identify the country’s key export (for instance, oil for Canada).
Track the relevant commodity’s price movement over time.
Compare those movements with the currency pair (USD/CAD).
Calculate a correlation coefficient over 6 to 12 months.
Cross-check the results with trade and GDP data.
Monitor news and central bank statements for consistency.
A consistent positive correlation suggests commodity dependence. For instance, when oil prices increase by 10 percent and CAD strengthens by 3 to 4 percent within weeks, it reflects strong sensitivity. The AUD and gold often display similar patterns, especially during risk-on phases.
This analysis does more than explain price history, it helps anticipate future trends. If commodity futures signal rising demand, traders can prepare for potential currency appreciation even before official data confirms it.
Benefits and Risks of Trading a Commodity Currency
The Advantages
Transparent Drivers: Commodity markets are widely tracked, giving traders clear signals about what might influence currency moves.
Fundamental Predictability: Since these currencies follow tangible resources, traders can apply macroeconomic logic rather than speculation.
Diversification Value: Commodity currencies behave differently from USD or EUR pairs, offering hedging opportunities across asset classes.
The Challenges
Volatility: Price swings in commodities can trigger abrupt currency moves.
Geopolitical Risks: Sanctions, conflicts, or trade restrictions can disrupt resource exports.
Inflation and Policy Risk: Rising commodity income can overheat economies, forcing sudden rate changes that impact currency pricing.
Effective trading of a commodity currency requires balance, combining awareness of commodity trends with disciplined risk management.
Case Studies, When Commodity Currencies Prove Their Link
CAD and Oil (2020 to 2023)
When oil prices collapsed below zero briefly in April 2020, the CAD fell sharply as Canada’s export income plunged. By 2022, as oil demand surged, the currency rebounded strongly. This cycle confirmed the CAD’s tight link to crude prices and its role as a barometer for the global energy market.
AUD and Iron Ore (2021)
Iron ore’s rise above USD 200 per tonne in early 2021 boosted Australia’s trade surplus and drove AUD/USD near yearly highs. Later that year, as Chinese steel output slowed, prices halved, and the AUD declined accordingly.
NZD and Dairy Prices (2022)
The NZD followed global dairy auction prices almost step for step. When average dairy prices dropped 10 percent mid-year, the NZD weakened proportionally, showing how agricultural cycles can directly impact forex performance.
Each case highlights how commodity-linked economies transmit real-world shifts into currency valuations faster than many traders expect.

How Traders Use Commodity Currencies in Forex
Commodity currencies serve as practical tools for analysing global economic cycles.
Macro Sentiment Gauges: Traders watch these currencies as early indicators of global growth or slowdown.
Correlation Trading: By pairing a currency trade with its related commodity, traders can profit from both markets.
Portfolio Hedging: Investors exposed to commodity prices may hold positions in related currencies to offset risks.
Multi-Asset Analysis: Integrating forex charts with commodity data enhances both strategy and timing.
For example, a trader bullish on oil might go long on CAD or short USD/CAD, aligning both asset classes. Similarly, anticipating stronger gold prices could support a positive outlook on AUD.
Such strategies highlight how commodity currencies can bridge the gap between macroeconomics and market execution.
The Future of Commodity Currencies (2025–2026 Outlook)
The global economy is expected to grow at around 3.3 percent in both 2025 and 2026, according to the IMF’s latest projections. The pace is steady but subdued, with inflation risks still present and commodity prices showing mixed signals. The U.S. Energy Information Administration (EIA) forecasts Brent crude oil averaging USD 62 per barrel in Q4 2025, easing to USD 52 in 2026 as global supply continues to outpace demand. Oil output is projected to rise by more than 2 million barrels per day in 2025 and a further 1.1 million in 2026, led by non-OPEC producers such as the U.S. and Brazil. This dynamic implies limited upside for energy-linked currencies like the Canadian dollar and Norwegian krone, which could remain range-bound unless OPEC+ curbs production more sharply or geopolitical risks tighten supply.
In contrast, industrial metals are entering a tighter phase. The International Copper Study Group (ICSG) expects the refined copper market to move into a 150,000-tonne deficit in 2026, reversing a previous surplus outlook due to lower-than-expected output in Chile, Indonesia, and Congo. The World Bank anticipates overall commodity prices to fall about 5 percent in 2025 and another 2 percent in 2026, though copper remains an exception because of structural demand from electrification and infrastructure. This environment supports metals-exposed currencies such as the Australian dollar (AUD) and South African rand (ZAR), especially as copper’s resilience offsets weaker energy benchmarks. Australia’s government continues to highlight iron ore as its largest export earner, but persistent softness in China’s property and steel sectors keeps the AUD sensitive to cyclical turns.
Agricultural and critical-mineral markets show a different picture. The FAO Dairy Price Index declined by 2.6 percent in September 2025, though it remains about 9 percent higher than a year earlier, while global cereal stocks are expected to expand by the end of the 2025/26 season, keeping food prices broadly stable. For the New Zealand dollar (NZD), this signals moderate but steady support rather than breakout strength. Meanwhile, the IEA’s Global Critical Minerals Outlook 2025 confirms that lithium prices are down more than 80 percent from their 2021–22 highs, with graphite, cobalt, and nickel also lower. Markets remain well supplied through 2026, and meaningful tightening is not expected until later in the decade. In short, 2026 is shaping up as a year of softer energy, resilient metals, and steady agriculture; a combination likely to favour the AUD and ZAR over CAD and NOK, while keeping the NZD stable amid subdued commodity volatility.
FAQs About Commodity Currency
Q1. What qualifies a currency as a commodity currency?
A currency earns that label when its value consistently tracks the export performance of key natural resources such as oil, metals, or agricultural goods.
Q2. Why do commodity currencies move with global prices?
Because rising export prices attract foreign currency inflows, boosting demand for the local currency. When prices fall, those inflows decline, leading to depreciation.
Q3. Which currencies are considered the main commodity currencies?
The Australian dollar (AUD), Canadian dollar (CAD), New Zealand dollar (NZD), Norwegian krone (NOK), and South African rand (ZAR) are the most recognised globally.
Conclusion
Identifying a commodity currency is about connecting forex movements with real-world economics. It involves studying how a nation earns, exports, and reacts to the global demand for natural resources. These currencies are more than trading instruments, they are living reflections of global commerce and investor confidence.
For traders, understanding a commodity currency provides clarity in an often chaotic market. It helps anticipate major shifts driven by energy prices, agricultural yields, or industrial demand. Mastering this connection transforms trading from guesswork into informed analysis.
Commodity currencies will continue to evolve, but their role as signals of global momentum will remain essential. Whether it is oil, gold, or the next generation of green commodities, these currencies will keep telling the story of how resources and money move the world.
Disclaimer: This material is for general information purposes only and is not intended as (and should not be considered to be) financial, investment or other advice on which reliance should be placed. No opinion given in the material constitutes a recommendation by EBC or the author that any particular investment, security, transaction or investment strategy is suitable for any specific person.
