Published on: 2025-08-05
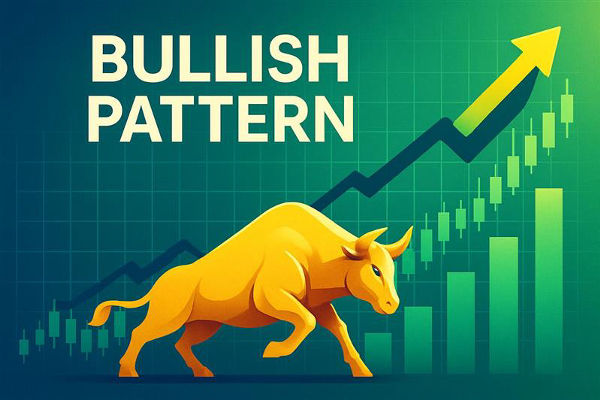
In technical analysis, a bullish pattern indicates the potential for a price rise and serves as an effective tool for traders looking to establish positions with upward momentum.
These patterns appear across different timeframes and asset types, including equities, forex, commodities, and cryptocurrencies, and assist traders in recognising trend continuations or reversals.
This guide explains what bullish patterns are, why they matter, the most commonly used types, and how beginners can apply them effectively.

A bullish pattern is a chart formation that suggests buyers are gaining control over price action. These patterns can indicate either a trend continuation, where an existing uptrend resumes or a trend reversal, signalling a shift from bearish to bullish sentiment.
Bullish patterns typically emerge alongside increasing volume and consistently higher lows, offering visual cues of accumulating upward momentum.
Recognising bullish patterns gives traders a strategic advantage:
They help identify high-probability entry opportunities.
Patterns define logical stop-loss and profit target levels, which improve risk management.
They reduce emotional decision-making by following rules-based signals.
When paired with volume surges or RSI intensity, they enhance trade dependability.

1. Double Bottom (W‑Pattern)
This reversal pattern forms when price hits a low, rebounds, drops again to a similar level, and finally moves upward. The troughs resemble the letter W. When price breaks above the peak between the two lows (the neckline), it usually signals a bullish reversal.
2. Inverse Head and Shoulders
Featuring three dips, where the middle "head" is deeper, this pattern becomes valid when the price moves above the neckline connecting the shoulders. It often marks a strong reversal of a downtrend.
3. Falling Wedge
Converging downtrend lines with lower highs and lower lows describe the wedge shape. As the price narrows into the wedge before breaking upward, it indicates either a continuation of bullish momentum or a reversal, based on the prior trend.
4. Bull Flag / Bull Pennant
After a sharp upward move, the price consolidates in a tight rectangle (flag) or small triangle (pennant). Continued momentum often pushes the price higher once consolidation ends, making it ideal for trend-following strategies.
5. Cup and Handle
Resembling a teacup with a handle, this pattern forms when price rounds lower (cup) and corrects slightly (handle) before breaking upward. It's a poised continuation pattern reflecting moderate profit-taking before another move up.
6. Ascending Triangle
Created by a flat resistance line with rising higher lows. Buyers consistently push up toward resistance, and a breakout above the flat top signals growing bullish strength.
7. Morning Star / Piercing Line (Candlestick Split‑bar)
Candlestick formations signalling reversal: a long bearish candle followed by a small indecision candle, then a bullish candle closing halfway or above the bearish candle's body marks a potential upward reversal.
8. Three White Soldiers
Three consecutive bullish candles, each with upward close and small wicks, often indicate strong momentum and signal bullish reversal or continuation.
1) Trend and Confirmation
Ensure the pattern aligns with the larger trend (unless reversal). Confirm breakout with volume increases, candlestick strength, or momentum oscillators.
2) Entry Guidelines
Enter on a candle close above the pattern boundary, such as the neckline or upper trendline. Use limit or market orders depending on volatility.
3) Stop‑Loss Placement
For reversal patterns, set the stop just below the pattern's swing low or opposite side of the handle. For continuation patterns, use a flag or wedge bottom as a reference. Risk no more than 1–2% of capital per trade.
4) Position Scaling and Trailing Stops
You can scale into positions if the breakout continues and trail stops below subsequent swing lows to lock in profits.

Example: Double Bottom on a Daily Stock Chart
Stock XYZ declines to ₹200 twice in a month, creating a double bottom. Volume increases on the second bottom, and price moves above the intervening peak at ₹215 (neckline).
Traders enter long after close above ₹215 with a stop just below ₹200 and a target equal to the height of formation (~₹30); target ~₹245.
Example: Bull Flag on XAU/USD 1H Chart
Gold rallies for several hours from $1,800 to $1,840, then consolidates sideways in a narrow range of $1,830–1,840. Following a surge past $1,840 accompanied by a volume increase, further movement towards $1,860 is expected.
Traders initiate positions at breakout, set stops at $1,828, and aim for targets derived from the measured flagpole (approximately $20).
In conclusion, bullish chart patterns are essential tools that help traders anticipate price direction and structure disciplined positions.
Although no pattern guarantees success, layering pattern recognition with volume confirmation, momentum indicators, and strict risk controls enhances trade quality.
Disclaimer: This material is for general information purposes only and is not intended as (and should not be considered to be) financial, investment or other advice on which reliance should be placed. No opinion given in the material constitutes a recommendation by EBC or the author that any particular investment, security, transaction or investment strategy is suitable for any specific person.