Published on: 2026-04-17
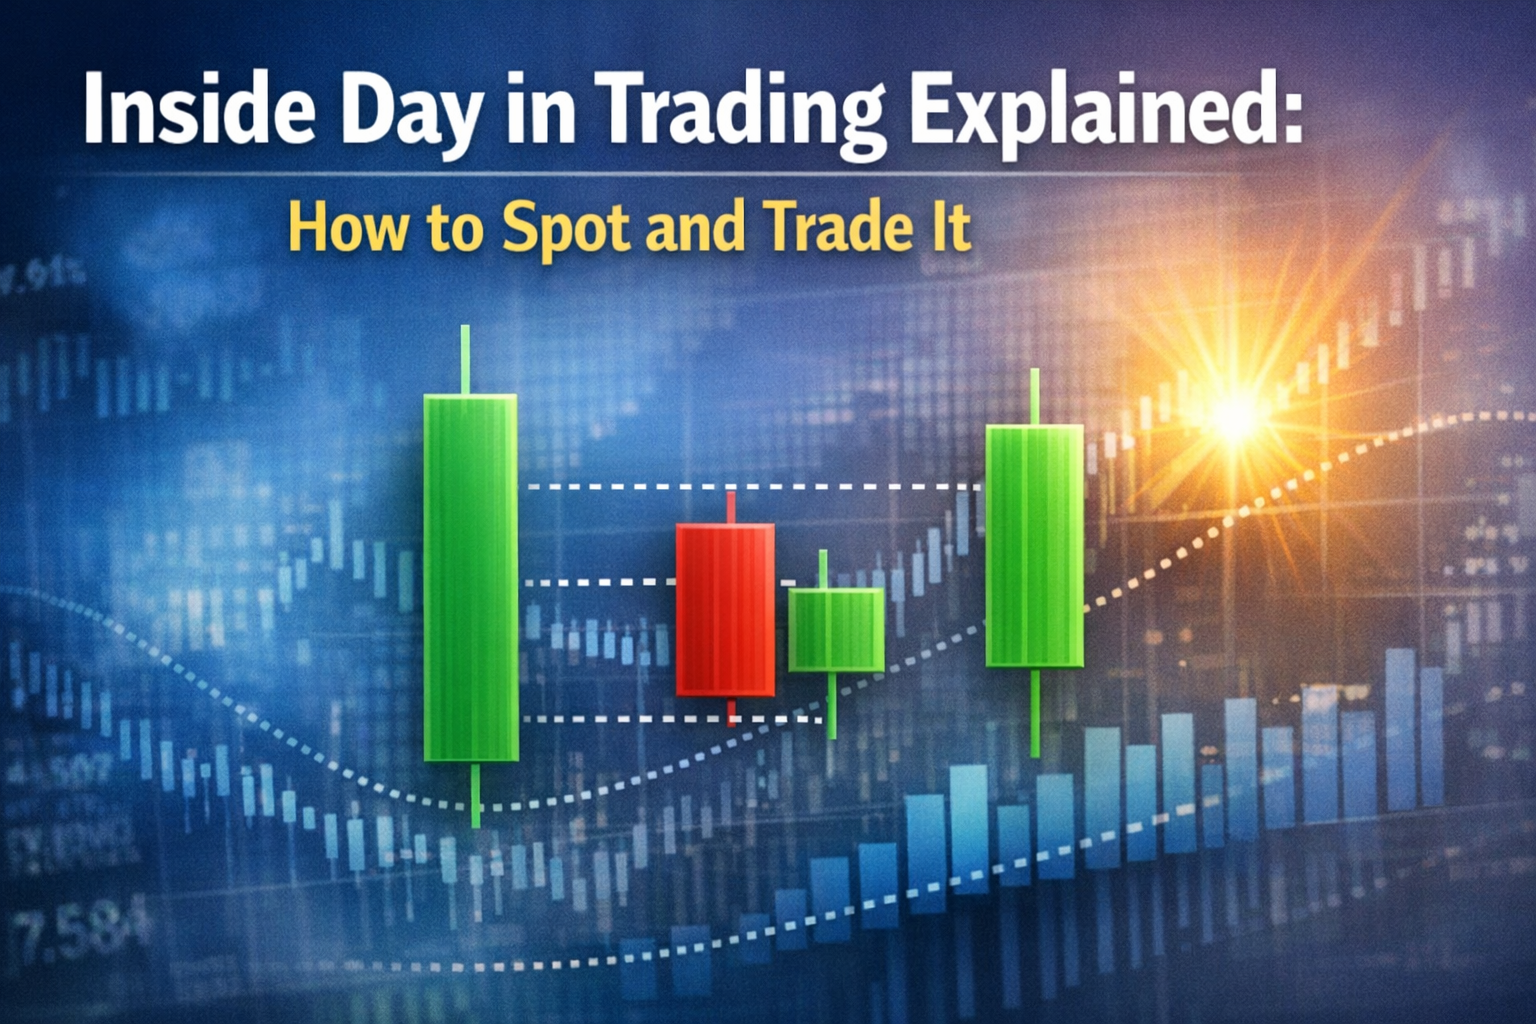
An inside day is a classic price action pattern that signals a temporary pause in volatility. It forms when the current day’s entire price range stays within the previous day’s range. Traders watch this setup because it can signal consolidation before a breakout, but the pattern remains neutral until the price confirms direction.

An inside day occurs when the current day’s high and low are fully contained within the previous day’s high and low.
It reflects volatility contraction and market indecision, not a bullish or bearish signal on its own.
Traders often watch for a breakout beyond the mother bar range, especially when the setup aligns with the broader trend or an important support or resistance level.
False breakouts are common, so confirmation and risk management matter. Volume can help confirm whether a move has real participation.
On lower timeframes, the same structure is usually called an inside bar rather than an inside day.
An inside day is a two-candle price pattern on a daily chart. It occurs when the current trading day’s high is at or below the previous day’s high, and the current day’s low is at or above the previous day’s low. The previous candle is often called the mother bar.
Current high ≤ previous high
Current low ≥ previous low
The pattern is defined by the full price range, meaning the high and low, not just the open and close.
An inside day indicates the market has retraced after a wider session. That contraction can lead to expansion later, which is why breakout traders pay attention to it. Still, the pattern does not predict direction on its own. Context is what makes it useful.
An inside day reflects a temporary balance between buyers and sellers. The market has paused, and neither side has pushed the price beyond yesterday’s range.
Common interpretations include:
Trend continuation pause: In a strong trend, an inside day can mark a brief pause before the trend resumes.
Potential reversal area: At a major support or resistance level, the pattern can appear before a reversal, but confirmation is still needed.
Volatility compression: A smaller range signals reduced volatility and the potential for a larger move once the price breaks out.
If two or more inside bars form within the same mother bar, the range is tightening even further. Many traders view that as stronger compression, though it still needs confirmation.
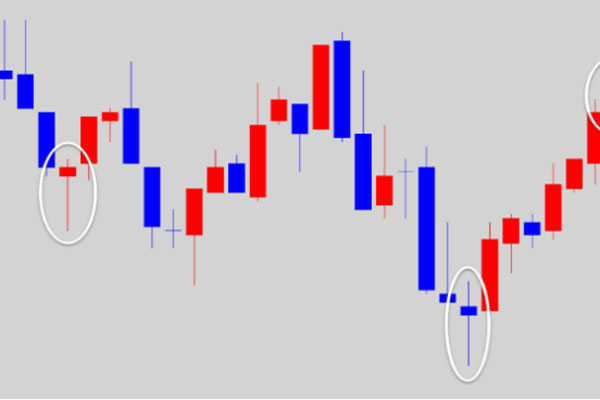
Identifying an inside day is simple when you focus on the price range rather than candle colour.
Find a clearly visible mother bar, usually a wider candle.
Check whether the next day’s high and low are fully inside that range.
Focus on the full range, not only the candle body.
Note the surrounding context, such as trend direction, support, resistance, and volume.
If a stock trades between $100 and $110 on Day 1 and between $102 and $108 on Day 2, Day 2 is an inside day because its full range is contained within Day 1's range. This is a valid example of range contraction.
The most important distinction is that an inside day is based on the full high-low range. A harami is based on the real body of the candles.

There is no single “best” inside day strategy. Most traders use the pattern as part of a broader plan rather than as a standalone trigger.
A common approach is to watch for the price to break beyond the mother bar range.
A bullish setup forms if the price breaks above the mother bar high
A bearish setup forms if the price breaks below the mother bar low
Some traders place stop-entry orders slightly beyond those levels. More conservative traders wait for the price to close outside the range before acting.
Inside days often attract the most attention when they form during a clear trend.
In an uptrend, traders may look for an upside breakout.
In a downtrend, traders may look for a downside breakout.
This does not guarantee continuation, but the surrounding trend can improve context.
Not all breakouts hold. Price can break one side of the pattern and then reverse sharply back into the range. Some experienced traders look for this kind of failure because trapped breakout traders can add momentum to the move in the opposite direction.
Because intraday periods are neutral in themselves, traders often look for confirmation before taking a trade. Useful confirmation tools may include:
Trend direction
Nearby support or resistance
Higher or improving volume on the breakout
A close outside the pattern range
Alignment with a broader technical plan
Volume is especially useful in stocks. Rising or above-average volume can suggest stronger conviction behind a move, while weak volume can signal limited participation.
Inside-day setups can offer a clear trade structure, but they are not foolproof. Risk management remains essential.
Place a stop-loss where the trade idea is clearly invalidated, often on the opposite side of the mother bar or beyond a nearby swing point.
Keep position size consistent with your risk plan.
Avoid forcing trades in choppy, low-conviction markets.
Be careful around major scheduled events, such as earnings or central bank decisions, because volatility can increase suddenly.
A tight pattern does not automatically mean low risk. A false breakout can still lead to a fast move against the position.
Inside days appear across stocks, indices, commodities, forex, and crypto. On non-daily timeframes, traders usually refer to the same structure as an inside bar. The pattern is often watched when markets pause before an important catalyst or after a strong directional move.
Examples include:
Stocks are consolidating before earnings.
Indices pausing ahead of major economic data or central bank announcements
FX and crypto charts showing the same compression pattern under the inside bar label
Trading every inside day without context
Confusing an inside day with a harami or a doji
Entering before the market actually confirms a breakout.
Ignoring the broader trend or nearby support and resistance
Overlooking volume and market conditions
Oversizing a trade just because the pattern looks “tight”
An inside day is neutral on its own. The eventual breakout, combined with trend and market context, determines whether traders interpret it as bullish or bearish.
Yes. Traders use the pattern in stocks, forex, commodities, indices, and crypto. The same structure also appears on lower timeframes, where it is usually called an inside bar.
There is no fixed reliability level that applies across all markets and timeframes. Historical studies and trading guides suggest the pattern often works better when used with the prevailing trend and confirmation, but false breakouts remain common.
The daily chart is the classic use case for an inside day. Many traders also use the same structure on lower timeframes, but those setups are usually called inside bars and can be noisier.
Beginners can study the pattern, but they should keep the process simple: use a clear market context, wait for confirmation, and define risk before entering. Technical patterns are tools, not guarantees.
The inside day is a simple yet useful price-action pattern. It indicates a narrowing of the range and can help traders spot potential breakout points. Its main value comes from structure: it gives a clear range, a clear invalidation point, and a clear reminder to wait for confirmation.