Published on: 2023-09-22
Updated on: 2026-05-19
The MACD golden fork dead fork strategy gives traders a simple way to read momentum shifts without turning the chart into a maze. A golden fork points to improving bullish momentum. A dead fork warns that momentum is weakening or turning bearish. The signal is easy to spot, but it becomes useful only when filtered by trend, price structure, and risk control.
That distinction matters in 2026 because markets still move sharply around interest-rate expectations, gold volatility and sudden changes in risk sentiment. The effective federal funds rate was 3.64% in April 2026, while gold moved above $4,000 per ounce in 2025. These conditions reward traders who confirm MACD signals rather than react to every crossover.

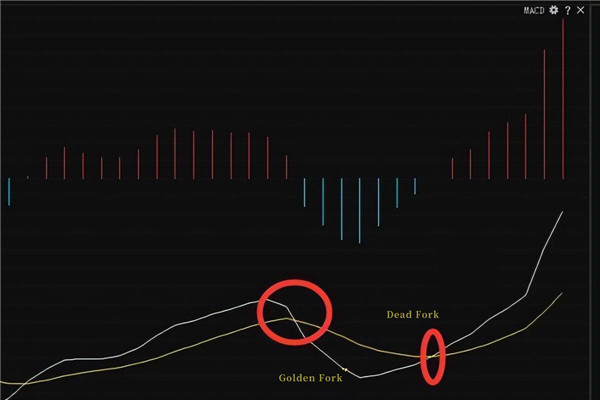
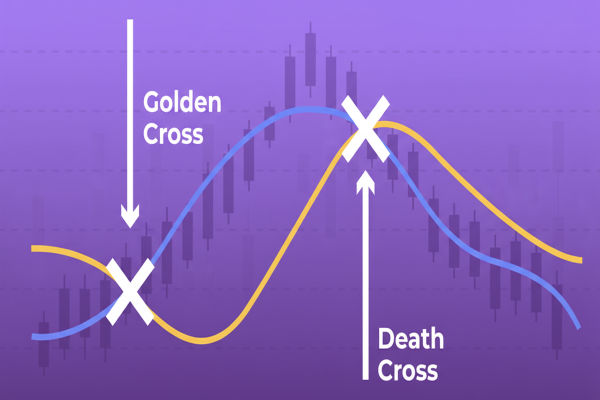
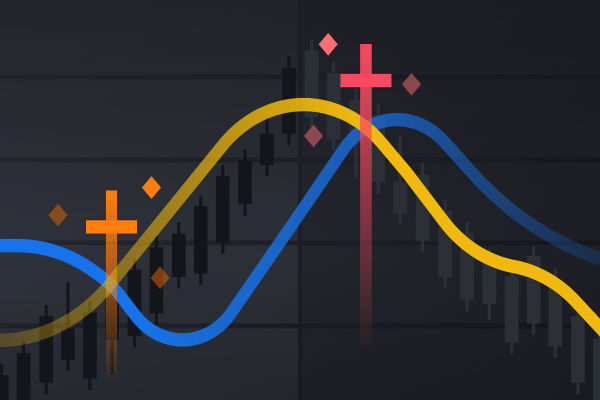
A MACD golden fork occurs when the MACD line crosses above the signal line, showing that bullish momentum is improving.
A MACD dead fork occurs when the MACD line crosses below the signal line, showing bearish pressure is increasing.
Signals below the zero axis for golden forks and above the zero axis for dead forks usually carry a cleaner reversal value.
The 200-day EMA helps filter direction: long signals work better above it, short signals work better below it.
A 51% win rate can still be profitable if the average winner is larger than the average loser.
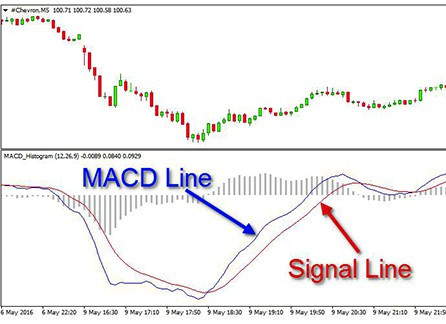
MACD stands for Moving Average Convergence Divergence. It is a momentum indicator built from moving averages. In its common setting, the MACD line subtracts the 26-period exponential moving average from the 12-period exponential moving average. A 9-period EMA of the MACD line becomes the signal line. The histogram shows the gap between the two.
The indicator shows whether momentum is rising or falling and whether short-term momentum is stronger than longer-term momentum.
MACD is not designed to show whether a market is “too expensive” or “too cheap.” A golden fork is not proof that buyers are too aggressive. It simply shows that bullish momentum has overtaken the signal line. A dead fork is not proof that the price must collapse. It shows that momentum has turned lower.
A MACD golden fork appears when the MACD line crosses from below to above the signal line. Traders usually read this as a bullish signal. If price is also making higher lows or breaking resistance, the signal becomes stronger.
A MACD dead fork appears when the MACD line crosses from above to below the signal line. Traders usually read this as a bearish signal. If price is also forming lower highs or breaking support, the signal deserves more attention.
The zero axis adds quality control. A c below the zero axis can signal that bearish momentum is fading and buyers are beginning to regain control. A dead fork above the zero axis can warn that a rally is losing strength before sellers fully take over.
Signals far from the zero axis need caution. A golden fork far above zero may come late after the price has already rallied. A dead fork far below zero may appear after the main decline has already happened.
The 200-day EMA acts as a trend filter. It does not predict the next candle. It simply tells traders whether the broader bias is bullish or bearish.
For a long setup, price should trade above the 200-day EMA or reclaim it with a strong close. The MACD line should form a golden fork, ideally near or below the zero line. Price should confirm the idea by holding a higher low or closing above resistance. The stop-loss is below the recent swing low.
For a short setup, the price should trade below the 200-day EMA or fail at it as resistance. The MACD line should form a dead fork, ideally above or near the zero axis. Price should confirm weakness by forming a lower high or breaking support. The stop-loss is above the recent swing high.
Assume EUR/USD trades above its 200-day EMA. The pair pulls back but holds previous resistance as support. MACD remains below zero, then the MACD line crosses above the signal line. The histogram turns positive.
That is a stronger golden fork because the signal appears after a pullback, not after an extended rally. Entry can come after the confirming candle closes, with a stop below the swing low and a target near the next resistance zone.
Gold shows the opposite risk. After a strong advance, a dead fork above zero may mark only a pause. In a powerful commodity trend, waiting for a support break or lower high is safer than shorting the first crossover.
Before entering any trade, define entry price, stop-loss and target. If the stop-loss equals $100 and the rule is to risk 1% per trade, the account needs at least $10,000.
A practical rule is simple: risk 1% or less per trade, target at least 1.5 times the risk, and avoid new entries during major news releases unless the strategy is designed for event volatility.
The most common mistake is trading MACD in a flat range. In sideways markets, the MACD line can cross the signal line repeatedly without the price moving far enough to reward the trade.
The second mistake is ignoring the zero axis. A golden fork below zero and a dead fork above zero usually offer better reversal timing than signals after a long one-way move.
The third mistake is confusing a signal with a complete plan. MACD can identify momentum. It cannot define account risk, choose position size or guarantee liquidity.
It can be, but only with confirmation. A golden fork is stronger when the price is above the 200-day EMA, forming higher lows or breaking resistance.
It can be, but traders should avoid treating it as automatic. A dead fork below the 200-day EMA or after a failed rally is stronger than a dead fork inside a powerful uptrend.
The standard 12, 26 and 9 setting is the most common. Traders may adjust it for shorter or longer timeframes, but changing settings should always be tested before live trading.
The MACD golden fork dead fork strategy works best as a disciplined momentum framework rather than a standalone prediction tool. A golden fork shows improving bullish pressure. A dead fork shows weakening or bearish pressure. The signal becomes more useful when it aligns with the 200-day EMA, the zero axis, and the price structure.
The best version of the strategy is also the simplest: trade with the broader trend, wait for confirmation, define the stop before entry and keep the reward larger than the risk. Used this way, MACD helps traders turn a common chart signal into a repeatable decision process.
Disclaimer: This material is for general information purposes only and is not intended as (and should not be considered to be) financial, investment or other advice on which reliance should be placed. No opinion given in the material constitutes a recommendation by EBC or the author that any particular investment, security, transaction or investment strategy is suitable for any specific person.