Published on: 2026-04-15
Updated on: 2026-04-15
Bioenergy margin trade is the right lens for this sector in 2026. Bioenergy is often presented as part of the clean-energy transition, but investors get a clearer picture when they treat it as a spread business. Producers buy feedstocks, process them into fuel, and earn money only when the value of the output exceeds the cost of the input, operating expense, and compliance burden.

Bioenergy also has a global footprint. The United States remains central, but Brazil, Europe, Indonesia, India, Canada, and Japan all matter because biofuels policy is increasingly tied to energy security, agricultural demand, and transport decarbonization.
The IEA expects growth in renewable fuels through 2030 to be concentrated in the United States, Europe, Brazil, Indonesia, and India, which together account for about 85% of the increase.
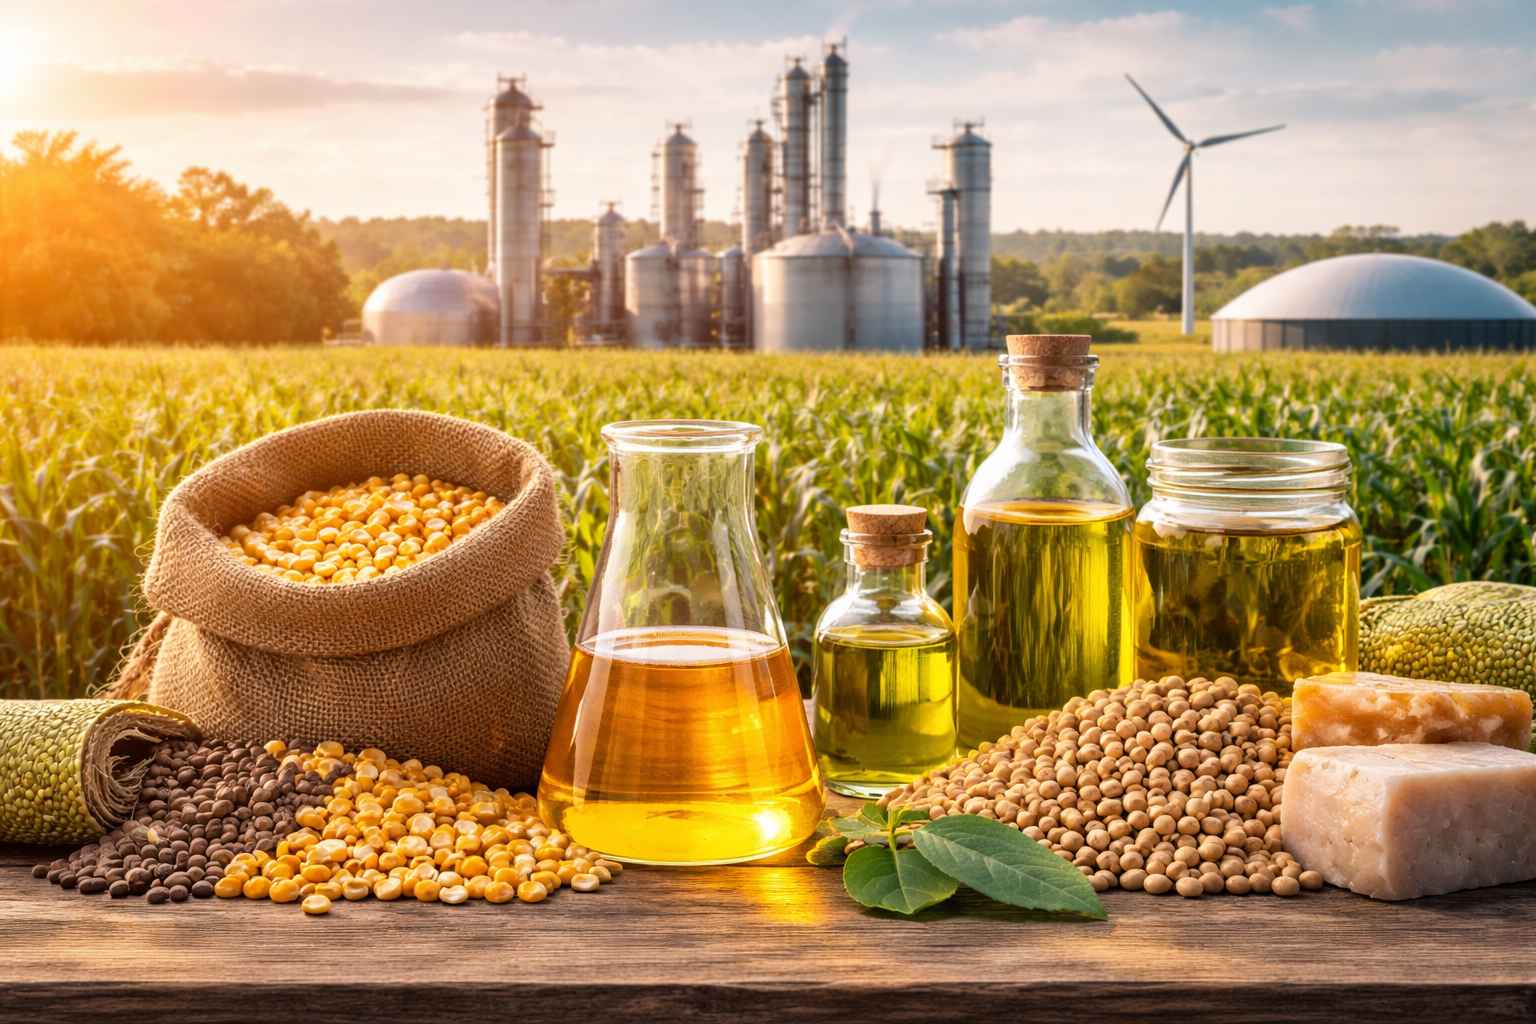
Bioenergy is energy produced from organic matter, including corn, sugarcane, soybean oil, used cooking oil, animal fats, forestry waste, crop residues, and biogas feedstocks. These materials can be processed into ethanol, biodiesel, renewable diesel, sustainable aviation fuel, biogas, or biomass-based power.
For investors, the key point is that bioenergy is not one product and not one market. In the United States, ethanol dominates the volume base. In Brazil, sugarcane ethanol plays a similar strategic role.
In Europe, biofuels policy is tied more closely to transport decarbonization and emissions standards. In Indonesia and India, blending mandates have helped turn biofuels into an energy-security story as much as an environmental one.
That is why bioenergy should be understood as an industrial conversion system. A producer secures feedstock, runs it through a plant, then sells fuel into an energy market shaped by commodity prices, regulation, and tax design. The financial outcome depends on margin quality, not simply on whether biofuel demand is growing in the abstract.
Bioenergy behaves more like refining than a utility-style renewable business. An ethanol producer buys corn and energy, then sells ethanol and co-products. A renewable diesel plant buys soybean oil, tallow, or used cooking oil, then sells a fuel that can carry both market value and compliance value. An SAF producer does something similar, but with a heavier policy and emissions component.
This is why investors should focus on spreads instead of headlines. A plant can increase output and still destroy value if corn rallies, soybean oil tightens, or credits weaken.
Equally, modest production growth can still support earnings if feedstocks ease and the realized value of the finished gallon improves. In bioenergy, throughput matters, but margin matters more.
The U.S. data illustrate the scale. Ethanol accounted for 82% of domestic biofuel production and 75% of consumption in 2022.

As of January 1, 2025, U.S. fuel ethanol production capacity stood at 18,477 million gallons per year, while renewable diesel and other biofuels capacity totaled 4,719 million gallons per year. This is a large industrial market, not a niche theme.
| Pathway | Main feedstocks | Main outputs | Margin lens |
|---|---|---|---|
| Ethanol | Corn, natural gas, power | Ethanol, DDGS | Corn-to-fuel spread |
| Renewable diesel | Soybean oil, used cooking oil, tallow | Renewable diesel | Feedstock-plus-credit spread |
| SAF | Waste oils, fats, approved low-carbon pathways | Sustainable aviation fuel | Feedstock plus carbon-intensity premium |
Feedstocks are the first variable to watch because they often determine whether a plant is economically competitive. In U.S. ethanol, corn is the main cost anchor. In renewable diesel and many SAF pathways, soybean oil, used cooking oil, and animal fats can determine whether a project earns an acceptable return.
When feedstocks rise sharply, margins compress even if oil prices are stable.

Country exposure matters here. Brazil’s ethanol economics are tied more closely to sugarcane. The United States depends heavily on corn and soybean-linked systems.
Indonesia’s biofuel strategy is tied more closely to vegetable-oil feedstocks, while India’s growth rests on policy support and rising fuel demand. Different countries therefore produce different bioenergy trades.
Finished-fuel prices matter, but they are only part of the revenue stack. Ethanol is linked to gasoline blending economics. Renewable diesel and SAF respond to diesel and jet-fuel pricing, but they also carry value from credits and tax rules. That is why one gallon of biofuel can be worth more than the visible benchmark on a screen.
In the United States, Renewable Identification Numbers, or RINs, are central to that pricing stack. EPA describes them as the currency of the Renewable Fuel Standard. Producers generate them, market participants trade them, and obligated parties retire them for compliance.
CME lists D4 Biodiesel RINs and D6 Ethanol RINs futures, which underlines that credits are not a side issue. They are part of the market structure investors need to understand.
The 45Z Clean Fuel Production Credit has made carbon intensity more financially relevant. The IRS states that the credit is available for clean fuel produced domestically beginning January 1, 2025, and sold by December 31, 2029.
Proposed regulations issued in February 2026 address eligibility, emissions rates, registration, and claim procedures. DOE’s 45ZCF-GREET model supports the emissions-rate calculations behind that framework.
That means bioenergy cash flow is increasingly policy-adjusted cash flow. A producer with cheaper compliant feedstocks and a stronger lifecycle emissions profile may deserve a better margin outlook than a producer with similar capacity but weaker feedstock access or poorer emissions scoring.
Investors do not need to build a refinery model to follow bioenergy. They do need to track four variables: feedstock prices, finished-fuel benchmarks, credit values, and capacity discipline. That checklist captures most of what drives earnings quality in the sector.
The supply side matters as well. EIA said U.S. biofuels production capacity growth slowed to 3% from the start of 2024 to the start of 2025, and weekly U.S. fuel ethanol production was 1,116 thousand barrels per day for the week ending April 3, 2026. Slower capacity growth can help margins if demand holds. Excess capacity usually does the opposite.
This also explains why bioenergy does not always trade with crude oil. Oil can be flat while bioenergy margins improve because corn or soybean oil is falling, or because credits are stronger.
Oil can rise while margins weaken because feedstocks are tightening even faster. Investors who treat bioenergy as a simple oil proxy usually miss the real drivers.
Not exactly. Biomass is a feedstock category. Bioenergy is the broader end use, including fuels, power, and gas made from biological material.
The United States, Brazil, Europe, Indonesia, and India are the most important growth centers, with Canada and Japan also relevant in advanced-fuels policy.
Because feedstocks often represent the largest variable cost. When they rise faster than fuel prices, producer margins usually narrow.
Bioenergy is easier to understand when it is treated as a margin business with a policy overlay. The sector converts agricultural and waste-based inputs into transport fuels whose value depends on commodity costs, market prices, credits, and tax rules.
That is why bioenergy margin trade explains the sector as it actually works in 2026, across the United States, Brazil, Europe, India, and Indonesia: not as a vague clean-energy theme, but as a cross-commodity market where feedstocks, fuel prices, and regulation meet in one investable spread.
Disclaimer: This material is for general information purposes only and is not intended as (and should not be considered to be) financial, investment or other advice on which reliance should be placed. No opinion given in the material constitutes a recommendation by EBC or the author that any particular investment, security, transaction or investment strategy is suitable for any specific person.