Published on: 2026-02-26
The Trading Dynamic Index (TDI) was developed to simplify this process. Instead of analysing multiple indicators separately, the TDI combines several analytical concepts into a single visual framework. Traders can observe momentum, trend direction, and volatility conditions together, helping them interpret market structure more efficiently.
One of the biggest challenges traders face is not a lack of information; it is too much information at once. Charts can quickly become crowded with indicators, each measuring different aspects of market behaviour. Momentum tools may suggest one direction, trend indicators another, and volatility measures something entirely different.
The Trading Dynamic Index (TDI) is a technical analysis indicator that integrates momentum, trend confirmation, and volatility analysis into one chart-based tool.
It is an RSI-based indicator enhanced with moving averages and volatility bands to provide a broader view of market conditions.
The indicator builds on the Relative Strength Index (RSI), a widely used momentum oscillator, and expands its functionality by smoothing price movements and adding volatility measures. This layered structure allows traders to interpret signals more clearly than with a standalone RSI.
The Trading Dynamic Index consists of several lines, each serving a specific analytical role.
| Component | Function |
| RSI Line | Measures underlying price momentum |
| Signal Line | Smooths RSI movement for crossover signals |
| Market Base Line | Represents broader trend direction |
| Volatility Bands | Reflect market expansion and contraction |

The indicator begins by calculating RSI values that measure the speed and strength of recent price changes.
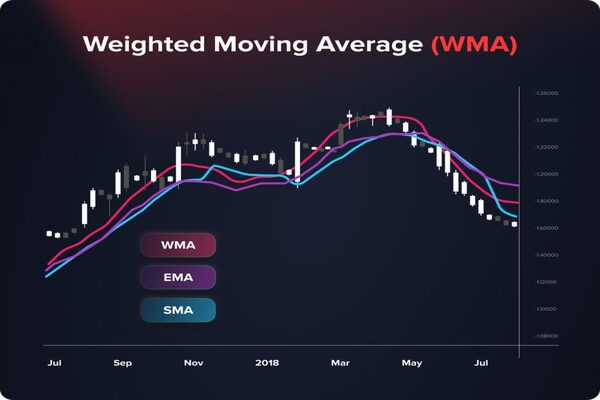
Moving averages are applied to the RSI data to reduce short-term noise. This smoothing helps traders identify momentum shifts more clearly.
Volatility bands expand when markets become active and contract during quieter periods, offering insight into changing trading conditions.
Traders observe relationships between the lines, especially crossovers and alignment, to interpret potential market momentum and trend strength.
Because several calculations operate simultaneously, the TDI functions as a multi-dimensional chart analysis tool.
The indicator reveals whether buying or selling pressure currently dominates the market.
The market baseline helps traders understand whether momentum aligns with a broader trend.
Expanding bands often signal increasing activity, while contracting bands suggest consolidation or reduced participation.
Momentum Crossovers: When the RSI line crosses above the signal line, traders often interpret it as a signal of strengthening upward momentum. A downward crossover may indicate weakening momentum. These are commonly referred to as TDI crossover signals.
Overbought and Oversold Conditions: Extreme readings may suggest stretched price conditions:
Higher levels can indicate overbought markets.
Lower levels may suggest oversold conditions.
However, strong trends can remain overbought or oversold for extended periods, so context remains important.
Trend Alignment: When the momentum direction aligns with the market baseline, traders often view trends as more stable or sustained.
Consider a trader analysing EUR/USD:
Price begins forming higher highs.
The RSI line crosses above the signal line.
Volatility bands widen, showing increased participation.
Momentum aligns with the market baseline direction.
Rather than treating this as a guaranteed trade signal, the trader interprets it as confirmation of strengthening bullish momentum supporting existing analysis.
This illustrates the intended use of TDI, assisting interpretation, not replacing decision-making.
Unified Market View: Multiple analytical concepts appear within one indicator window.
Improved Signal Clarity: Smoothing reduces noise compared to raw momentum readings.
Versatility: The TDI acts as a momentum, trend, and volatility tool simultaneously.
Accessible for Beginners: Its visual structure helps newer traders understand market behaviour more intuitively.
Like most technical indicators, TDI relies on historical price data and reacts after price movement begins. Frequent crossovers may occur when markets lack clear direction. The indicator performs best when combined with broader technical or risk management frameworks. Recognising these limitations helps traders avoid overreliance on any single indicator.
Relative Strength Index (RSI): A momentum oscillator measuring price strength and speed of movement.
Momentum Indicator: A technical tool used to evaluate trend strength.
Volatility Bands: Ranges showing periods of market expansion or contraction.
Trend Confirmation: Evidence supporting continuation of a price trend.
Technical Analysis: The study of price charts and indicators to interpret market behaviour.
It helps traders analyse momentum, trend direction, and volatility simultaneously.
Yes, though one should use it alongside broader chart analysis and risk management.
Yes. One can apply it to stocks, commodities, and indices.
No indicator guarantees accuracy; signals require confirmation.
Higher timeframes often produce clearer signals, though usage depends on strategy.
It primarily lags because the calculations rely on historical price data.
Most traders use it as confirmation rather than a standalone trading system.
The Trading Dynamic Index provides traders with a structured way to interpret market behaviour by combining several analytical concepts into a single visual tool. Expanding the RSI framework with trend and volatility components helps traders understand price momentum within a broader market context.
For beginners, the TDI simplifies complex technical analysis ideas. For experienced traders, it provides an additional confirmation layer within established strategies. Therefore, the value of the Trading Dynamic Index lies not in predicting markets, but in helping traders read them more clearly and consistently.
Disclaimer: This material is for educational and informational purposes only and does not constitute investment advice, financial advice, or a recommendation to trade. Trading and investing involve risk, and past performance of any indicator or strategy does not guarantee future results. Investors should conduct independent research and consider their financial circumstances before making investment decisions.