Published on: 2026-02-27
Updated on: 2026-02-27
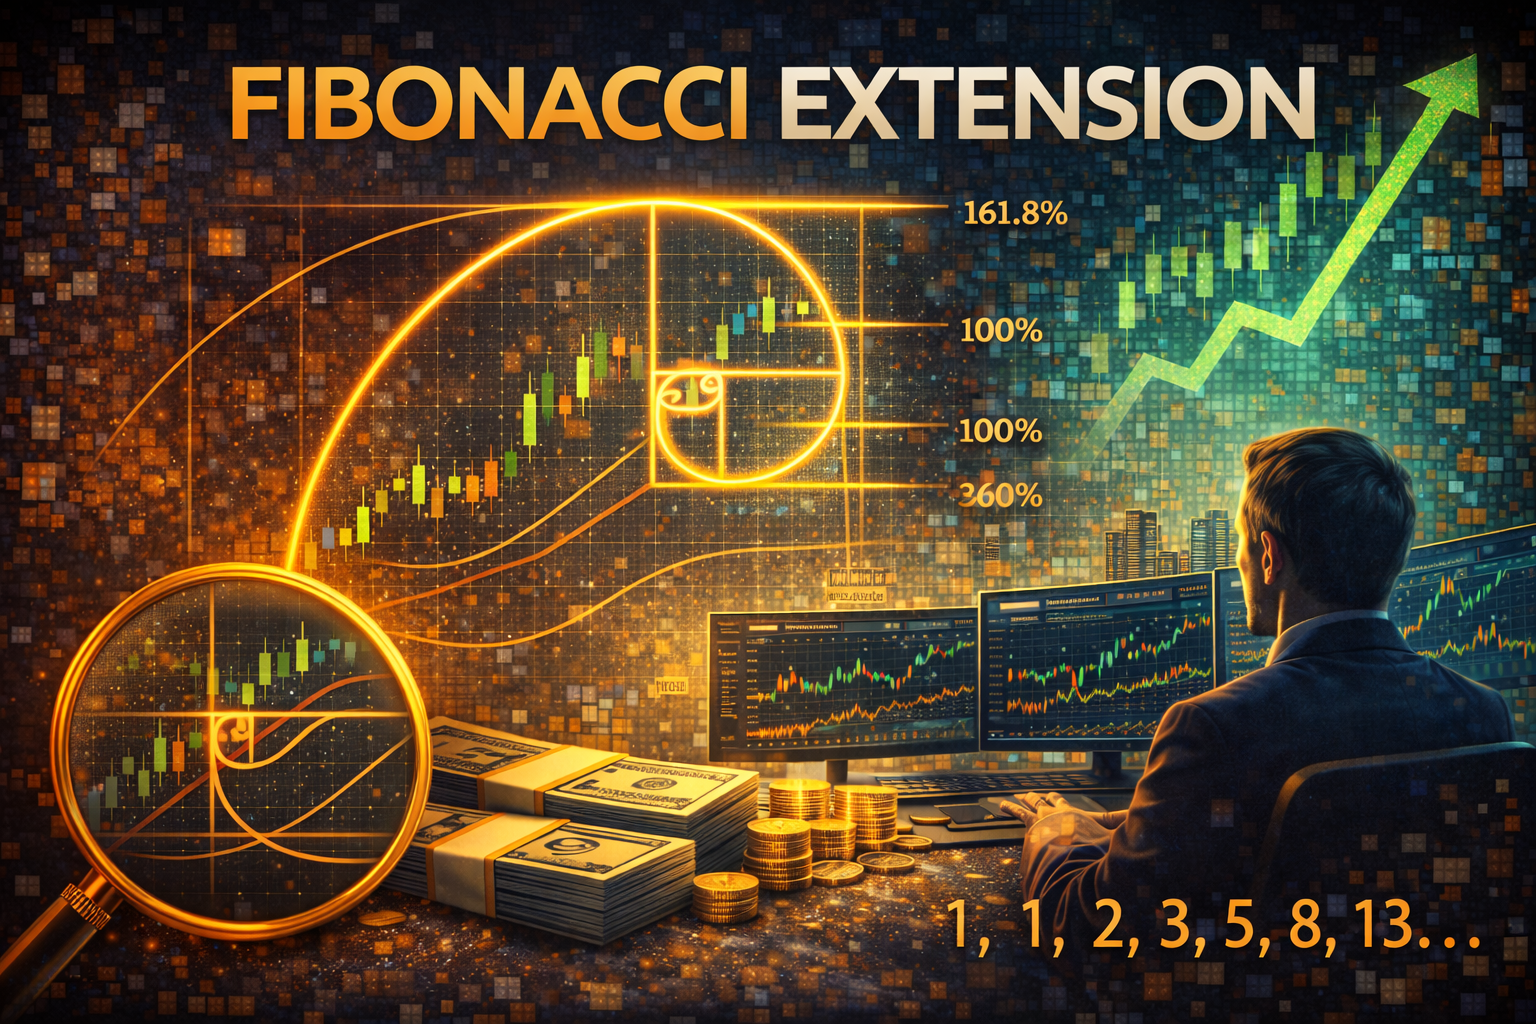
Fibonacci extensions are widely used to estimate momentum continuation and identify logical profit-taking zones in modern technical analysis. It becomes useful when traders face challenges in finding out where a price move might end.
Entering a trade is often easier than deciding where to take profit. Markets rarely stop at obvious levels, and emotional decision-making can lead traders to exit too early or too late. Rather than guessing future price levels, traders use mathematical ratios derived from market structure to project possible targets beyond the current trend.
A Fibonacci Extension is a technical analysis tool used to project potential price targets beyond an existing price move. It helps traders estimate how far a trend may continue after a pullback or correction.
Unlike retracement tools, which measure how far the price pulls back, Fibonacci extensions focus on future price projection levels once the trend resumes.
These levels are calculated using ratios derived from the Fibonacci sequence, often associated with the “golden ratio” found in mathematics and nature.
Common Fibonacci extension levels include:
127.2%
161.8%
261.8%
423.6%
These percentages represent potential areas where price momentum may slow, pause, or reverse.

127.2% Level: Often viewed as the first momentum target during moderate trends.
161.8% Level (Golden Ratio): The most widely watched level in golden ratio trading, frequently used for profit targets.
261.8% and Above: Typically appear during strong trending markets driven by high momentum.
These levels do not predict reversals; instead, they highlight areas where traders monitor price behaviour.
The Fibonacci extension indicator is applied using three key price points on a chart: the start of a price move, the end of the initial move, and a pullback or retracement point. The tool then projects extension levels beyond the original trend.
| Step | What Happens |
| Identify trend | Locate a strong price movement |
| Measure Swing | Select start and end points |
| Mark Retracement | Choose correction level |
| Project extensions | Indicator generates price targets |
This makes Fibonacci Extension a practical trend-continuation indicator within broader chart analysis.
| Feature | Fibonacci Extension | Fibonacci Retracement |
| Purpose | Project future targets | Measure pullbacks |
| Direction | Beyond current price | Within existing move |
| Usage | Profit targets | Entry zones |
| Market Phase | Trend continuation | Trend correction |
Retracement's answer: “Where might the price pull back?”
Extensions answer: “Where might the price go next?”
Traders typically follow this workflow:
Identify Market Structure
Look for a clear trending move followed by a pullback.
Apply the Tool
Select the three swing points described earlier.
Watch Extension Levels
Observe how the price behaves near projected targets.
Combine With Confirmation
Many traders use extensions alongside:
support resistance tools
chart pattern analysis
momentum indicators
Imagine a currency pair rising from 1.1000 to 1.1200 before pulling back to 1.1100. After applying the Fibonacci Extension:
127.2% projects near 1.1250
161.8% projects near 1.1320
Traders may treat these as Fibonacci price targets, watching whether momentum slows or continues. This approach helps traders plan exits logically rather than reacting emotionally.
Fibonacci Extension matters because trading decisions often break down at the exit stage rather than at the entry stage. Many traders know when a trend begins but struggle to define realistic profit targets. Extension levels provide structured reference points, helping traders plan trade management before emotions influence decisions.
Additionally, Fibonacci levels are widely followed across global markets. Because many participants watch similar ratios, price reactions may occur around these zones. This shared attention turns Fibonacci extensions into a practical framework for analysing market momentum rather than a predictive formula.
| Advantages | Limitations |
| Provides structures price targets | Does not predict exact reversals |
| Easy to apply on most trading platforms | Depends on correct swing selection |
| Works across multiple asset classes | Less effective in sideways markets |
| Supports disciplined profit planning | Requires confirmation from other indicators |
| Complements other technical analysis tools | Can produce different results between traders |
Fibonacci Retracement: A tool measuring potential pullback levels within a trend using Fibonacci ratios.
Support and Resistance: Price zones where buying or selling pressure historically appears.
Trend Continuation: Market movement that resumes in the original direction after a correction.
Divergence: A condition where price movement and an indicator move in opposite directions, potentially signalling weakening momentum.
Technical Analysis: The study of price charts and indicators to interpret market behaviour.
Fibonacci Extension helps traders estimate potential price targets after a trend resumes. By projecting levels beyond current price action, it supports structured exit planning and helps traders evaluate how far momentum may continue during trending markets.
Yes, beginners can use Fibonacci Extension because most platforms automate calculations. However, understanding market structure and combining it with other technical analysis tools improves reliability and helps avoid interpreting levels as guaranteed outcomes.
No. Fibonacci Extension identifies potential reaction zones rather than predicting reversals. Traders use it as a reference area where price behaviour may change, not as confirmation that the market will definitely stop or reverse.
One can use the tool for forex, stocks, indices, and commodities. It tends to perform best in trending markets with clear price swings, making it popular among swing traders and trend-following strategies.
Many traders monitor Fibonacci ratios, creating a shared market reference. This collective attention can influence trading behaviour, sometimes leading to price reactions near extension levels due to clustered orders and profit-taking.
The Fibonacci Extension is a practical technical analysis tool that helps traders project potential price targets beyond an existing trend. By using mathematical ratios combined with market structure, traders gain a framework for planning exits and evaluating momentum continuation.
Rather than forecasting the future, Fibonacci extensions provide structured guidance to help traders shift from emotional decision-making to disciplined chart analysis. When combined with broader technical analysis tools, they become a valuable part of a well-rounded trading approach.
Disclaimer: This article is for educational purposes only and does not constitute investment advice, trading recommendations, or financial guidance. Financial markets involve risk, and past performance or technical indicators do not guarantee future results. Traders should conduct independent research and consider their risk tolerance before making trading decisions.