Published on: 2026-03-25
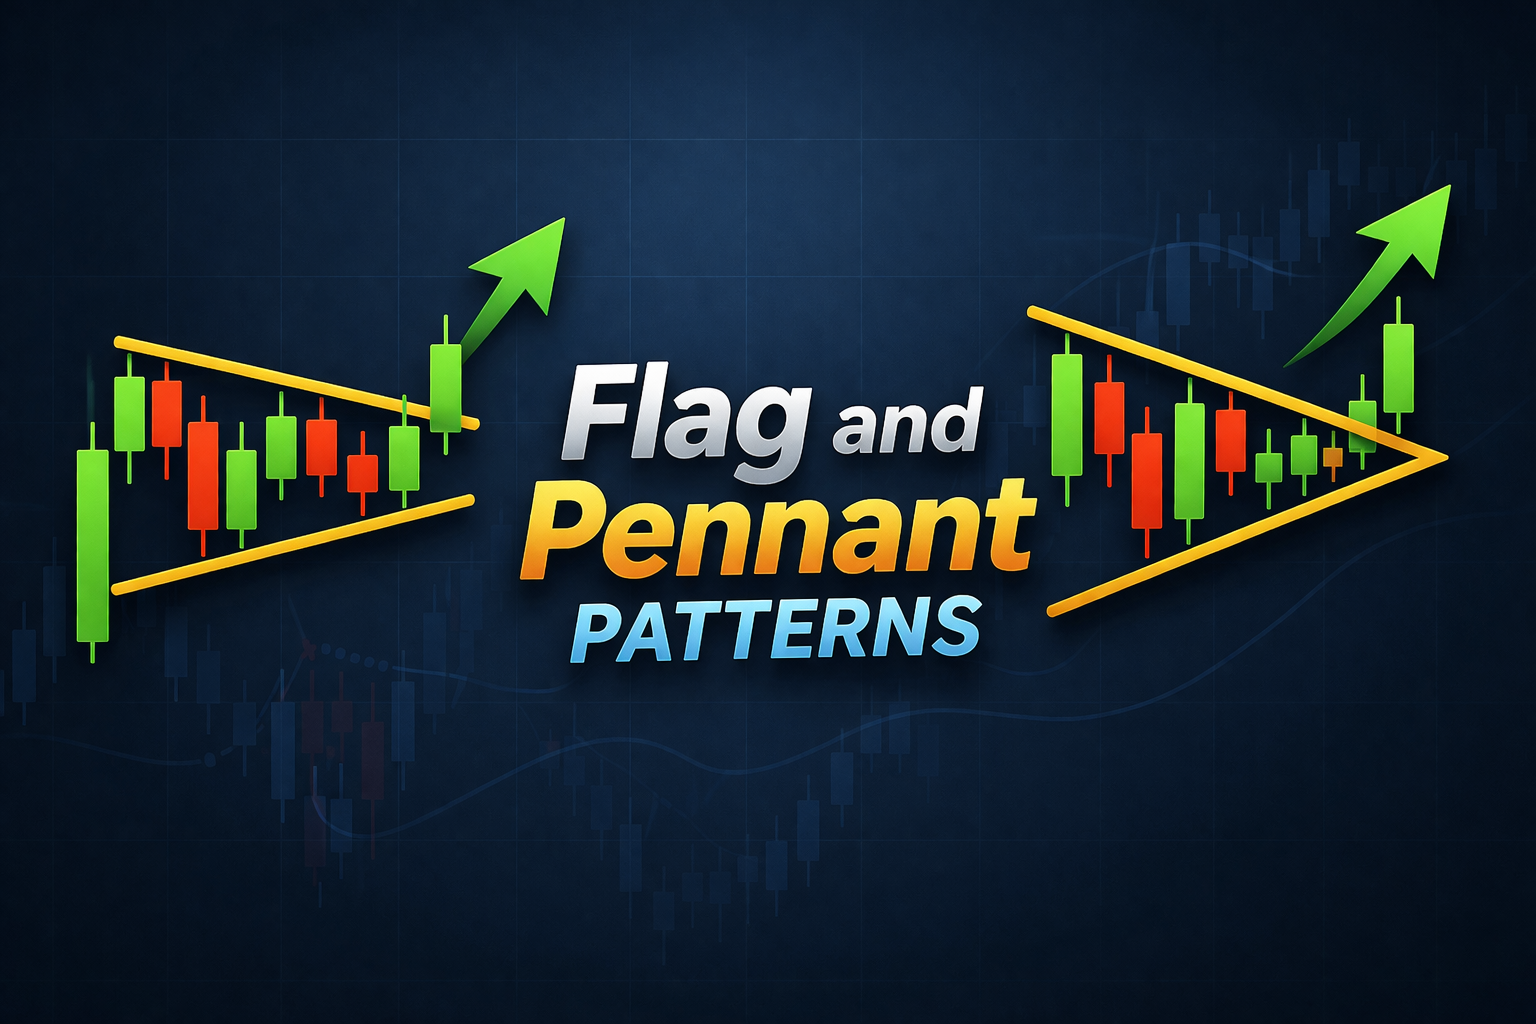
Flag and pennant patterns in trading are technical chart formations that can signal a continuation of a trend. These patterns help traders and investors identify moments when a market is likely to resume its previous price direction after a brief pause.
Technical analysis patterns such as flags and pennants are widely studied because they provide visual cues that reflect market psychology and potential price movements.
Flag and pennant patterns are continuation formations that appear after strong price moves and before further trend continuation.
A flag pattern forms as a small rectangular channel moving against the prevailing trend.
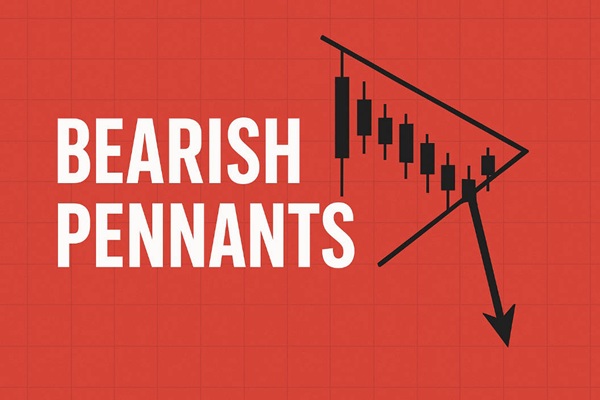
A pennant pattern resembles a small symmetrical triangle formed by converging trend lines.
Both patterns offer entry points for trend continuation trades with defined risk and reward areas.
Misidentification and premature entries are common mistakes that can lead to losses.
These patterns can be used alongside other indicators to enhance the reliability of trade signals.
A flag pattern is a technical chart pattern representing a brief consolidation before the previous trend resumes. It is one of the most recognisable continuation patterns in technical analysis because of its simplicity and high probability.
A flag pattern forms after a strong directional price move, often called the flagpole. After this initial move, the price enters a channel that runs counter to the trend. For an uptrend, the flag slopes downward. For a downtrend, the flag slopes upward.
Flagpole: The initial sharp move higher or lower.
Flag Body: A small rectangular area formed by two parallel lines that slope against the trend.
Volume Pattern: Volume often decreases during the flag formation and expands when the breakout occurs.
Breakout: A decisive price move above the flag pattern in an uptrend or below the flag in a downtrend.
Here is a simplified table to understand the visual structure of a flag pattern:

Flag patterns emerge as traders take profits after sharp price moves. The market pauses to consolidate and absorb previous gains or losses before continuing in the original trend direction. This consolidation reflects a temporary balance between buyers and sellers.
A pennant pattern is another continuation pattern that resembles a flag but has unique features that distinguish it from a flag.
After a strong price advance or decline, prices consolidate in a small symmetrical triangle formed by two converging trend lines. Unlike a flag channel, a pennant contracts over time, indicating that the price range is narrowing. With a strong breakout, the price typically continues in its prior direction.
Flagpole: The strong price move preceding consolidation.
Triangle Formation: Converging support and resistance lines forming a small triangle.
Volume Characteristics: Volume drops during the pennant formation and expands on the breakout.
Breakout Direction: The breakout generally occurs in the direction of the original trend.
While both patterns are continuation patterns, a pennant shows contraction through converging lines, whereas a flag forms a parallel channel. Below is a side-by-side comparison:

Pennant patterns reflect a temporary balance between buyers and sellers as traders hesitate after a strong move. The contraction signals dwindling volatility before a breakout. This consolidation allows traders to prepare for a breakout in the direction of the trend.
Understanding the differences between flag and pennant patterns is important for applying the correct trading strategy.
Shape: Flags form rectangular channels. Pennants form small triangles.
Trendlines: Flags have parallel lines. Pennants have converging lines.
Slope: Flags typically slope against the trend. Pennants may not have a clear slope until breakout.
Consolidation: Flags indicate tighter, but uniform, consolidation. Pennants indicate a narrowing of the price range.
Proper identification ensures that traders do not confuse one pattern for another. Mistaking a flag for a pennant or vice versa could lead to incorrect entry or exit decisions and may affect risk management strategies. Both patterns work best with volume confirmation.
Trading flag and pennant patterns requires discipline, risk management, and confirmation. Technical analysts and traders often use these patterns in combination with support and resistance levels.
Identify the Pattern: Confirm the initial sharp move and the consolidation phase.
Volume Confirmation: Look for declining volume during consolidation and increasing volume at breakout.
Entry Point: Enter a long trade on a breakout above the upper boundary in an uptrend or a short trade below the lower boundary in a downtrend.
Stop Loss Placement: Place a stop loss slightly below the consolidation area in an uptrend and above it in a downtrend.
Profit Target: Use the height of the initial flagpole as a guide to estimate the potential price move after breakout.
Some traders pair flag and pennant analysis with momentum indicators such as the Relative Strength Index (RSI) or Moving Average Convergence Divergence (MACD). These additional tools can help confirm the breakout's strength and reduce false signals.
Even experienced traders can misinterpret patterns or enter trades prematurely. Below are common mistakes and how to avoid them.
Misidentifying the Pattern: Traders sometimes call any consolidation a 'flag' or a 'pennant'. Ensure the pattern meets all criteria: clear pole, defined consolidation, and volume characteristics. Misidentification can lead to poor trade setups.
Ignoring Volume: Breakouts without volume confirmation often fail. Volume should increase at the breakout for a valid signal.
Entering Too Early: Entering a trade before the breakout closes above or below the pattern boundary increases the risk of false signals. Waiting for a confirmed breakout improves probability.
Poor Risk Management: Not placing a stop loss or placing one too tight can lead to avoidable losses. Always define risk levels before entering a trade.
Neglecting Broader Market Context: Patterns are more reliable when aligned with broader market trends. Trading against major market direction can reduce the odds of a successful breakout.
A flag pattern shows a consolidation channel with parallel trendlines, while a pennant pattern forms a small symmetrical triangle with converging trendlines. Both signal continuation of the prior trend after consolidation.
Both patterns are considered reliable when the breakout is accompanied by increased volume and confirmed by other technical indicators. However, no pattern guarantees outcomes in all market conditions.
Yes, flag and pennant patterns can occur in all time frames from minutes to daily and weekly charts. The reliability often increases with longer time frames.
Yes, volume confirmation strengthens the validity of breakouts. A breakout with rising volume is generally more trustworthy than one with weak volume.
These patterns are primarily used by traders to time short- to medium-term entries. Long-term investors can use them as one factor among others for understanding potential trend continuations.
Flag and pennant patterns in trading are powerful continuation signals that appear after strong price moves. Understanding their structures, differences, and how to trade them properly can help traders make better-informed decisions.
Flag patterns form rectangular consolidation channels that lean against the trend, while pennant patterns form small triangles with converging lines. Both patterns require volume confirmation and precise entry and exit strategies.
Disclaimer: This material is for general information purposes only and is not intended as (and should not be considered to be) financial, investment or other advice on which reliance should be placed. No opinion given in the material constitutes a recommendation by EBC or the author that any particular investment, security, transaction or investment strategy is suitable for any specific person.