Published on: 2026-07-23
Updated on: 2026-07-24
Crude at $100 a barrel transmits through equity markets asymmetrically. For producer-heavy benchmarks it lifts energy-sector cash flow and index-level earnings; for markets dominated by manufacturers, transport operators and consumer names it lands as a cost shock and inflation impulse.
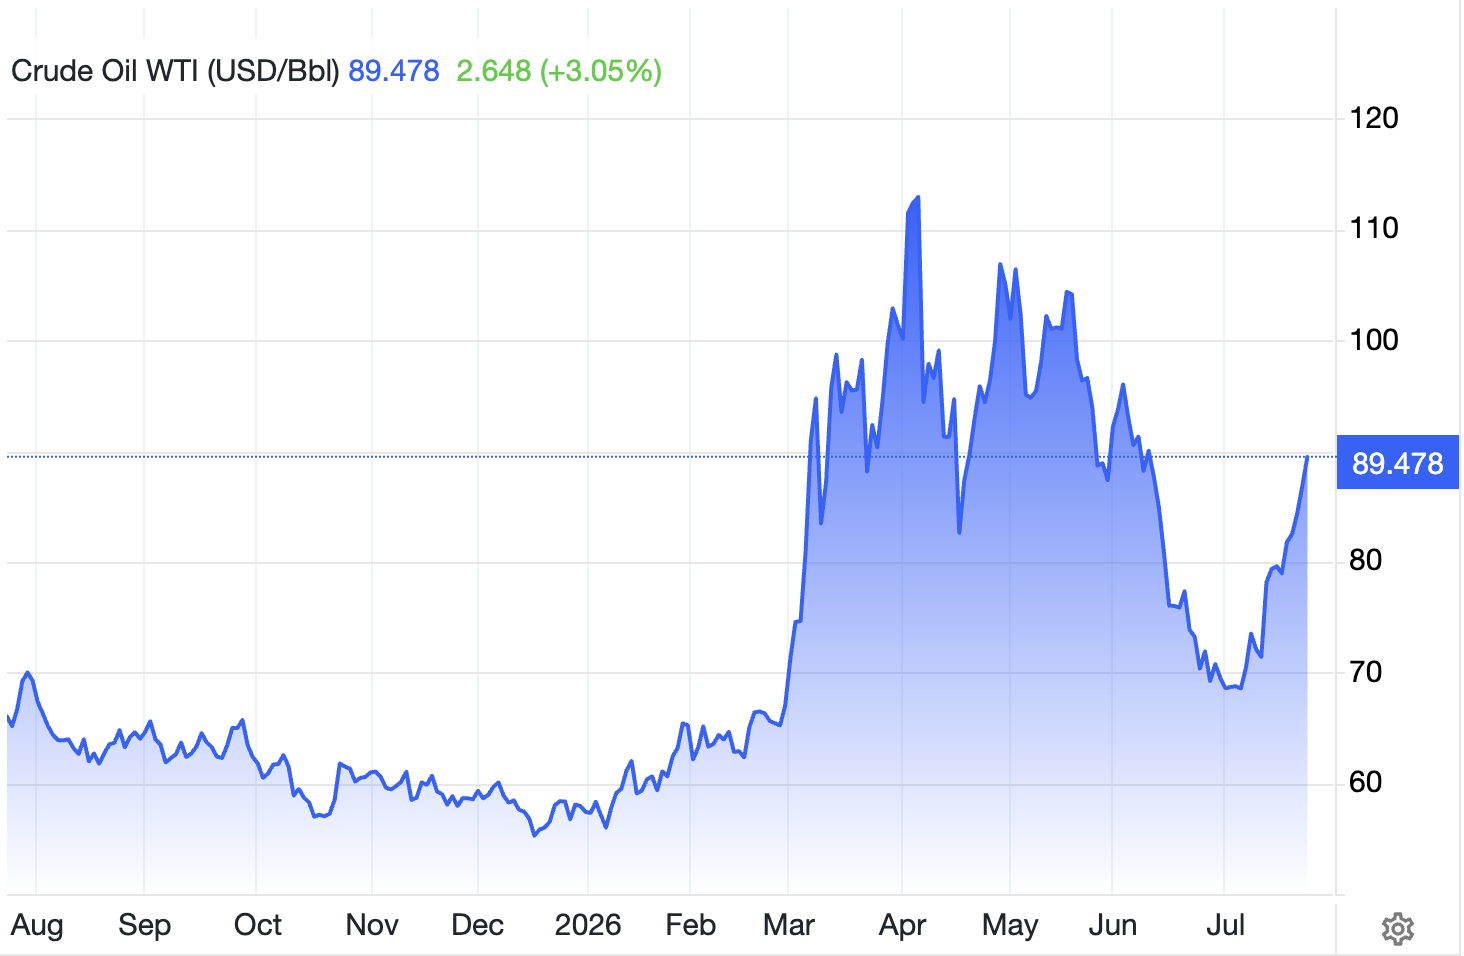
Understanding which stock markets benefit from higher oil prices, and which don’t, starts with what’s actually inside each index, not just its headline “energy” label. The move in Oslo bears little resemblance to the move in Tokyo or Mumbai.
Three variables govern the outcome: genuine exposure to upstream producers within the index, the economy’s structural dependence on imported crude, and the market’s sensitivity to the inflation, currency and rate consequences of a supply-driven price rise.
Energy Minerals accounted for 26.7% of the OBX Index as of 31 March 2026, the strongest direct producer exposure in this comparison.
Energy represented roughly 18% of the S&P/TSX Composite, with Canada a major net hydrocarbon exporter.
The Nikkei 225 and Nifty 50 pair heavy import dependence with minimal upstream exposure.
Shell and BP give the FTSE 100 more insulation from rising crude than the UK economy has on its own.
The S&P 500’s thin energy weight (about 2.9%) means consumer and inflation drag could neutralise producer gains.
| Index | Direct oil or producer exposure | Economy’s oil position | Base-case effect from a supply-driven $100 oil shock |
|---|---|---|---|
| OBX Index, Norway | 26.7% Energy Minerals, 31 Mar 2026 (Euronext) | Major net exporter | Strongly positive |
| S&P/TSX Composite, Canada | ~18% energy, 30 Apr 2026 (fund factsheet) | Net hydrocarbon exporter | Positive |
| FTSE 100, UK | ~9–11% (sector-weight trackers, 2025–26) | Net importer, but hosts global oil majors | Modestly positive / relatively resilient |
| S&P 500, US | ~2.9% as of Jan 2026 (S&P sector data) | Producer/exporter, but net crude importer | Mildly negative to neutral |
| DAX 40, Germany | No oil/gas producer among top holdings (Jul 2026) | Import dependent | Negative |
| Nikkei 225, Japan | Inpex is the only major producer; price-weighted structure limits its influence | Overwhelmingly import dependent | Strongly negative |
| Nifty 50, India | 9.79% oil, gas and consumables, largely Reliance (NSE, 30 Jun 2026) | ~88–89% import dependent | Strongly negative |
Methodology. This is a qualitative screen across four factors (upstream producer weight, net oil-trade position, currency vulnerability and inflation sensitivity), not a weighted numerical score; treat the “effect” as a directional read, not a calibrated forecast. It assumes crude holds near $100 for several weeks on supply-led rather than demand-led drivers; a transient spike or a demand-driven rally would alter the conclusions.
A sizeable energy sector doesn’t, by itself, make an index a beneficiary of higher crude. Oil, gas and consumable fuels represented 9.79% of the Nifty 50 in the NSE’s 30 June 2026 factsheet, with Reliance Industries alone at roughly 8.00%.
Yet Reliance spans refining, petrochemicals, upstream energy, telecom and retail rather than pure production: higher crude raises feedstock costs, but the net earnings impact is mediated by refining margins, petrochemical spreads and upstream realisations.
Compounding this, India imports close to 88-89% of the crude it consumes, exposing the economy to a wider import bill, rupee depreciation and firmer inflation.
The OBX Index and S&P/TSX Composite show a more direct relationship with the oil price: their energy exposure is concentrated in large upstream producers, and both sit within net-exporting economies, pairing index-level earnings upside with a supportive national income backdrop.
Same sector label, opposite economic direction, which is exactly why upstream weight, trade position and currency sensitivity need to be read together rather than in isolation.

Energy Minerals represented 26.7% of the OBX Index as of 31 March 2026, per Euronext, with Equinor at 16.83% and Aker BP a further 6.23%.
Higher crude would broadly support producer cash flow, Norwegian export receipts and government petroleum revenue, feeding transfers into the Government Pension Fund Global.
Realised earnings still turn on volumes, fiscal take, hedging, gas prices and operating costs, but the OBX offers the strongest mix of producer exposure and exporter status here.
Energy accounted for roughly 18% of a fund tracking the S&P/TSX Composite as of 30 April 2026, ranking alongside financials and materials among its dominant sectors.
Canada exported roughly 6.5 million barrels of oil equivalent per day of hydrocarbons (crude, natural gas, NGLs and refined products combined) in 2025, against imports of about 1.5 million, per the Canada Energy Regulator.
A sustained rise would likely reinforce both corporate earnings and export income. Suncor and Canadian Natural Resources stand to capture the most direct upside; midstream operators may benefit from stronger throughput, though their revenue is less spot-sensitive, anchored in contracted volumes, tariffs and regulated returns.
The UK remains a net importer of primary oil, leaving households and domestically focused businesses exposed to higher fuel costs. Sector-weight trackers have put FTSE 100 energy exposure at roughly 9-11% through 2025-2026, concentrated in Shell and BP, which earn across global upstream, trading and refining rather than the domestic market alone.
That weight could plausibly lift the FTSE 100 on an energy-led session and help it hold up better than many European peers.
That’s a screen supported by the sector’s size, though not confirmed against historical event data. The result is an index that looks relatively resilient sitting atop an economy that still absorbs imported inflation.
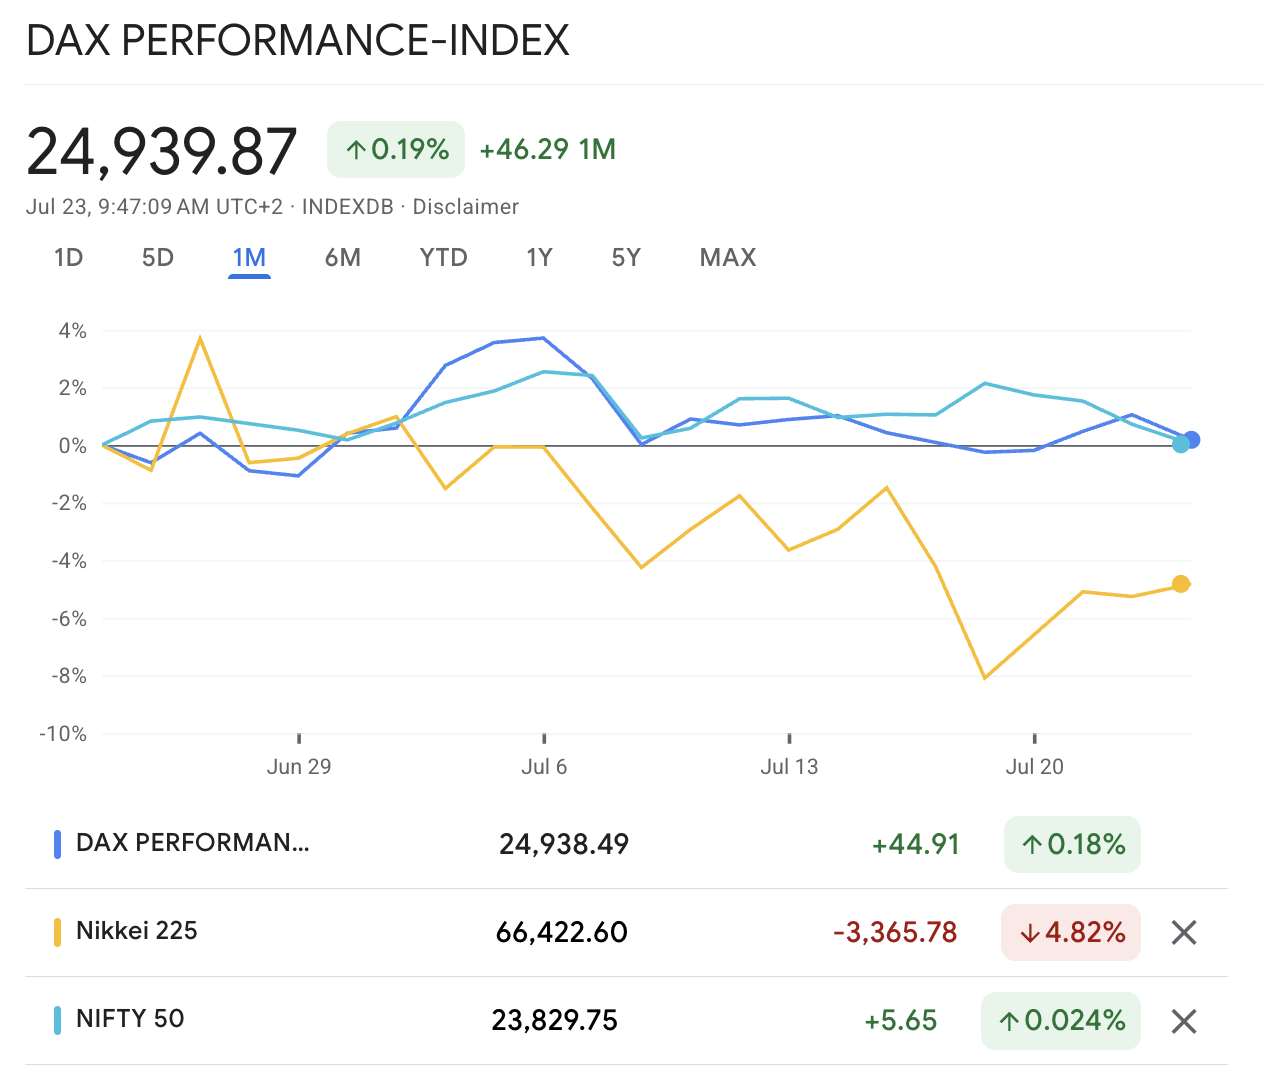
Japan relies overwhelmingly on imported crude, particularly Middle Eastern supply. Inpex, the country’s largest listed oil and gas producer, sits well outside the Nikkei’s most influential names given the index’s price-weighted construction, which lets nominal share price, not market value, set influence.
Higher crude raises input costs across the automakers, exporters and industrials that anchor the benchmark, and a softer yen would amplify the local-currency cost of imported energy, with negligible producer earnings to cushion it.
No oil-and-gas producer ranks among the DAX 40’s top constituents as of July 2026; the nearest energy-related name, Siemens Energy, is a power-equipment and grid business rather than an upstream producer.
The index’s heaviest sectors (automakers, industrials, software, insurers and chemicals) derive no clean benefit from higher crude, while Germany’s reliance on imported energy exposes its export-oriented manufacturing base to higher production and transport costs.
Reliance lends the Nifty 50 more apparent energy exposure than the Nikkei or DAX, but its diversified model limits the index’s direct crude sensitivity.
The larger risk is macroeconomic: a prolonged rise widens the current-account deficit, pressures the rupee and stokes inflation. Fuel taxes, subsidies and administered pricing may defer the effect but cannot remove the underlying increase in the national oil bill.
The S&P 500’s energy weight had compressed to about 2.9% as of January 2026, against roughly 16% during the 2008 commodity cycle, as technology came to dominate the benchmark. US crude production averaged a record 13.6 million barrels per day in 2025, per the EIA, yet the country still imports more crude than it exports.
That’s a genuinely mixed national exposure. Higher prices would aid producers while raising costs for airlines, transport, manufacturers and consumers, and persistent energy inflation would complicate the Federal Reserve’s rate path.
Given the index’s thin energy weight, the broader drag could offset much of the producer benefit, leaving a base case of mildly negative to neutral.
A single-session spike can move energy equities without shifting corporate guidance. A price sustained near $100 for several weeks feeds through into inventories, currencies, consumer behaviour and earnings forecasts.
For the OBX and TSX, the benefit would likely surface in realised selling prices, cash-flow expectations and revised guidance. For import-dependent markets, companies may trim margin forecasts, currencies may weaken, and central banks may reassess whether the shock is broadening into wages and services inflation rather than a one-off to be looked through.
The longer the price holds, the more pronounced the divergence tends to become.
Norway’s OBX Index and Canada’s S&P/TSX Composite screen as the clearest beneficiaries here, combining high upstream producer weight with net-exporter status at the national level.
Mixed. Its energy weight has fallen to about 2.9%, so producer gains are unlikely to offset broader consumer-cost and inflation pressure at the index level, even though the US itself is a major producer and exporter.
Sector weight measures ownership of “energy” companies, not producer purity. Where that weight sits in refiners or diversified conglomerates rather than upstream producers, as with Reliance in the Nifty 50, rising crude can raise costs faster than it lifts revenue.
Under a sustained supply shock, the OBX Index and S&P/TSX Composite hold the clearest potential to benefit from $100 oil; the Nikkei 225, DAX 40 and Nifty 50 face the greatest pressure; and the FTSE 100 and S&P 500 sit between.
The outcome turns on the interaction of producer exposure, import dependence and the inflation response, assessed as a qualitative screen rather than a scored forecast. It’s also a local-currency view, so returns for foreign investors could shift once exchange rates are factored in.