Published on: 2026-07-17
A market can look ready to explode long before it chooses a direction. Price pushes higher, stalls below the previous peak, then pulls back. Buyers step in sooner than before. The next rally stops even lower. Another dip finds support at a higher level. The swings keep shrinking until price is boxed between two converging trendlines.
That is the symmetrical triangle pattern. Traders watch it because tight ranges often lead to sharp moves. The difficulty is knowing whether the breakout has real force behind it or whether price is about to snap back inside the triangle.
A symmetrical triangle forms through lower highs and higher lows.
It shows tightening price action, not a guaranteed direction.
The previous trend can shape expectations, but the breakout decides the trade.
Stronger breakouts close clearly outside the pattern and move with wider candles.
Weak breaks often leave long wicks, lose momentum and fall back inside.
Entries, stops and targets should be planned before price reaches the edge.
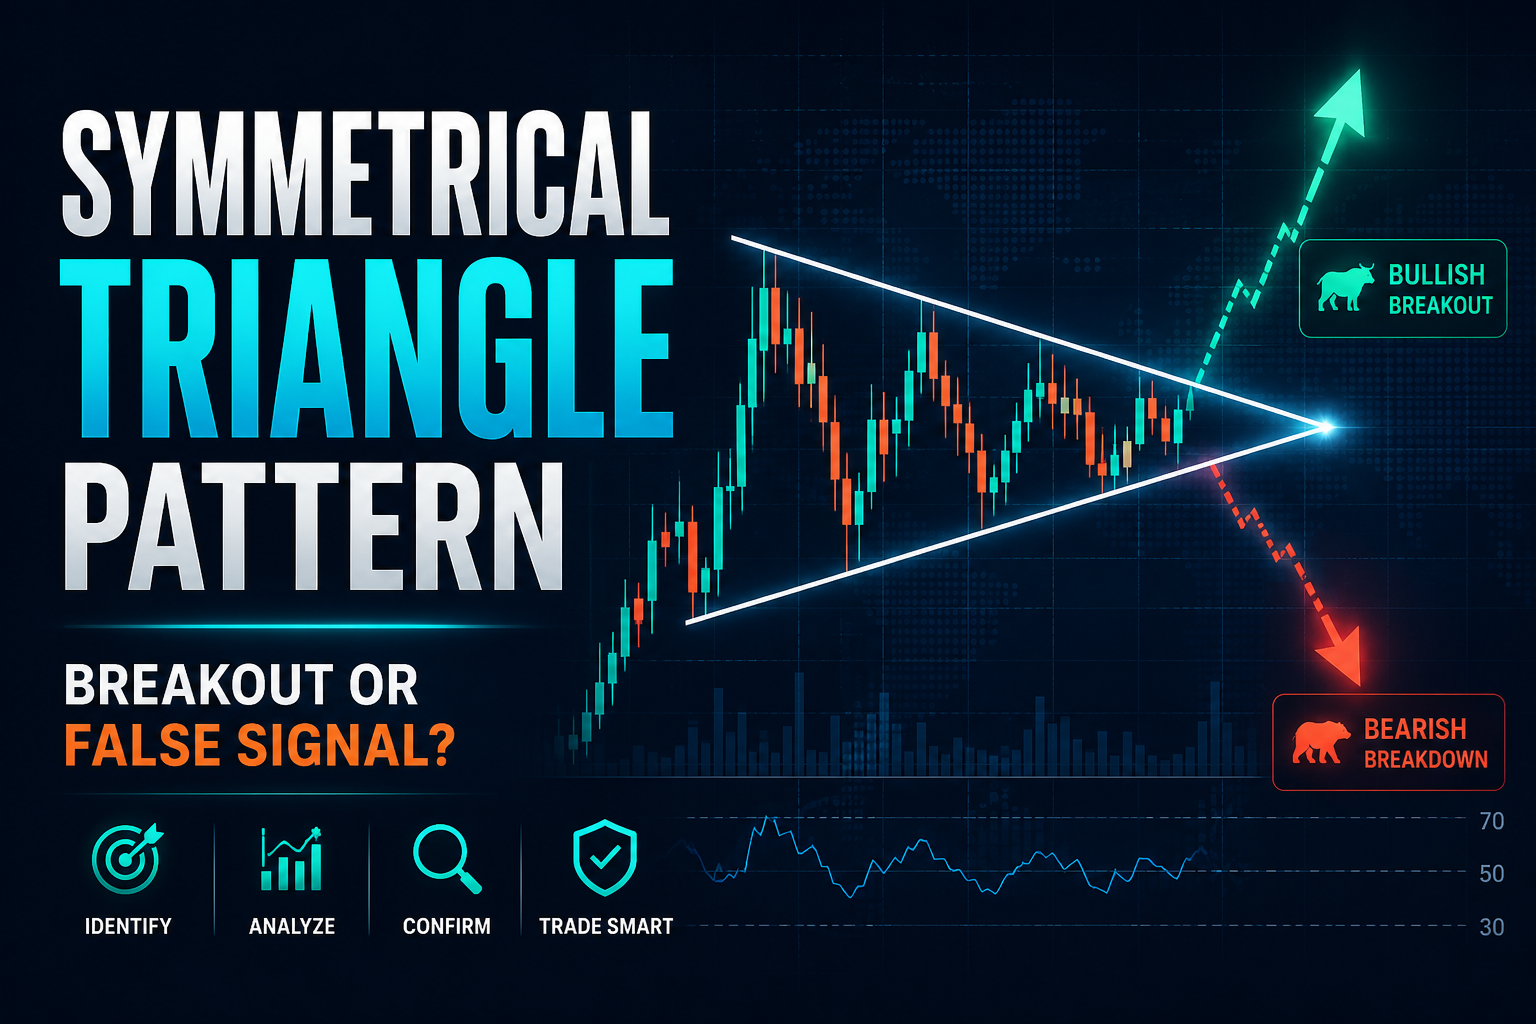
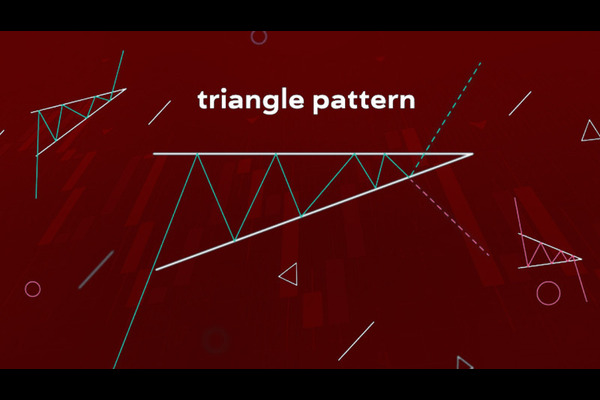
A symmetrical triangle appears when price moves between falling resistance and rising support.
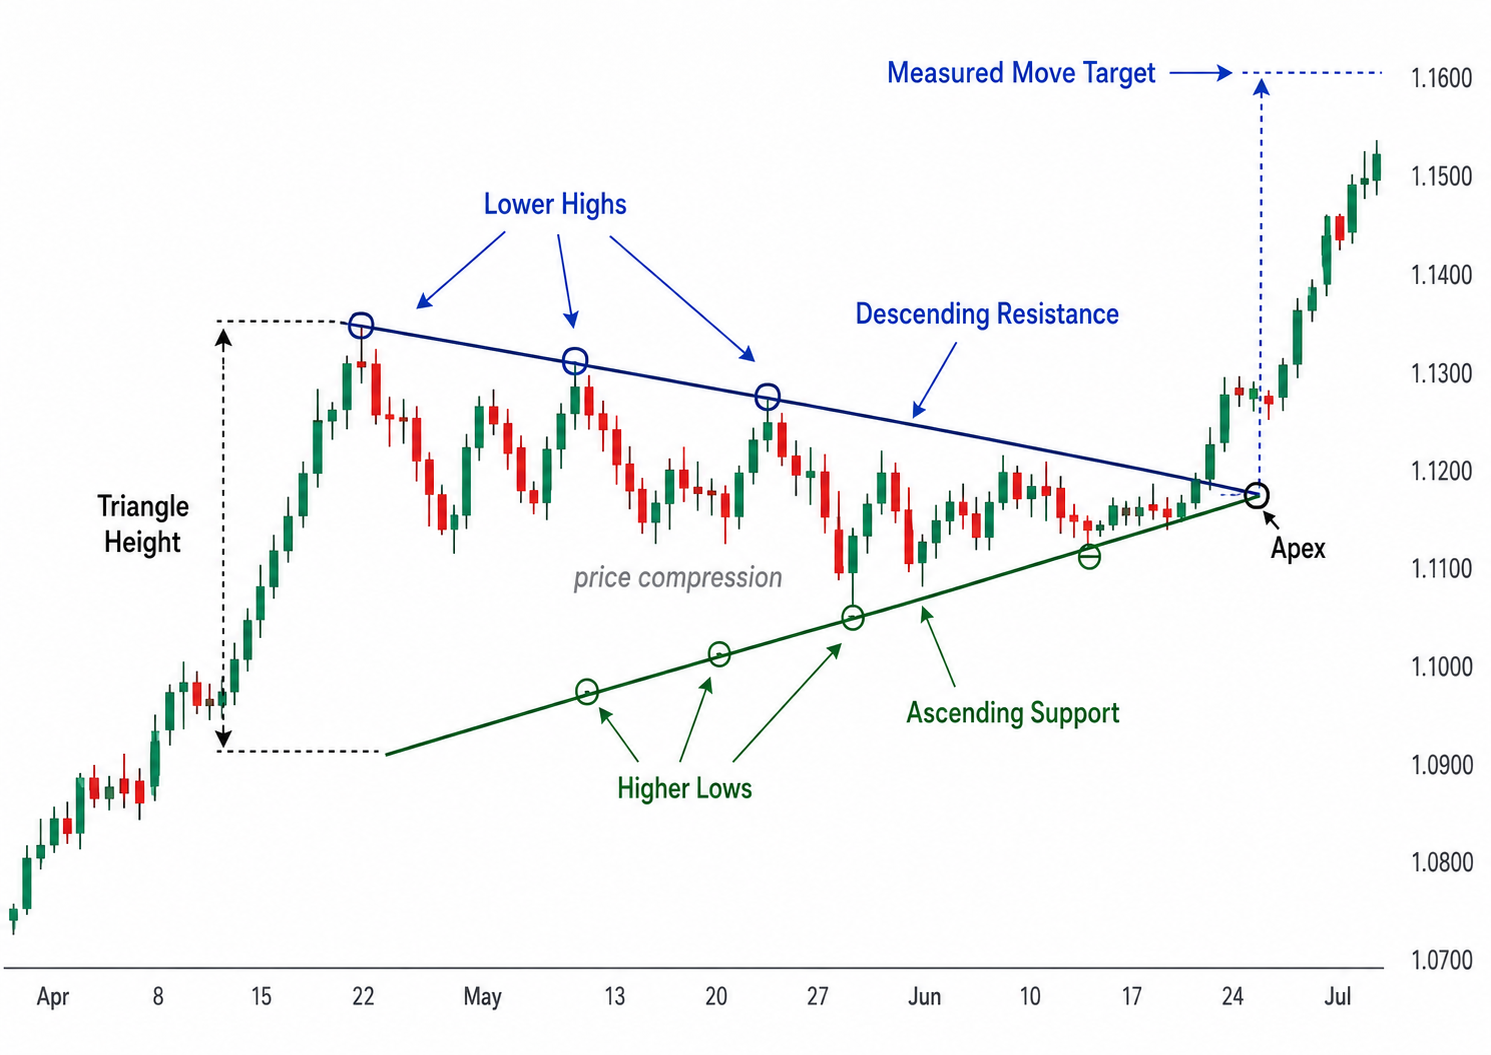
The upper trendline joins a series of lower highs. The lower trendline joins a series of higher lows. As the two lines move closer together, the trading range narrows.
A trader looking at the chart would see each rally running out of energy sooner. At the same time, each pullback would attract buying before reaching the previous low.
The pattern needs clear swing points. Two reactions on each side are usually sufficient to draw the structure with confidence. More touches can make the boundaries easier to see, but repeated closes through the lines weaken the setup.
A symmetrical triangle is different from other triangle patterns:
| Pattern | Upper Boundary | Lower Boundary | Typical Bias |
|---|---|---|---|
| Symmetrical triangle | Falling | Rising | Neutral until breakout |
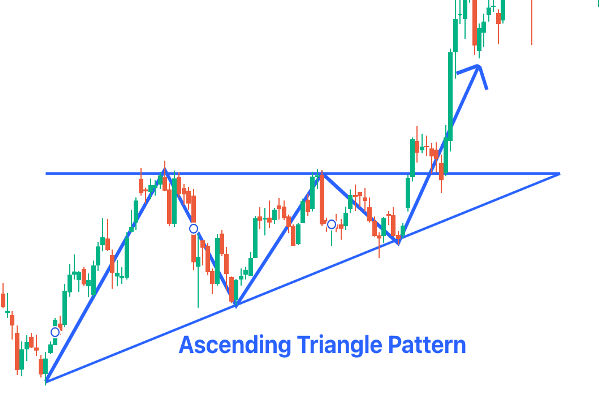
| Ascending triangle | Horizontal | Rising | Often bullish |
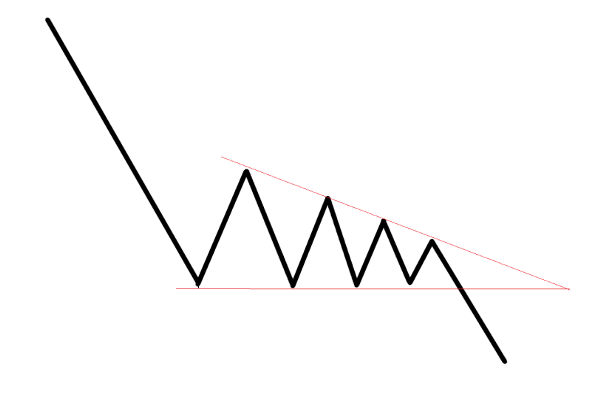
| Descending triangle | Falling | Horizontal | Often bearish |
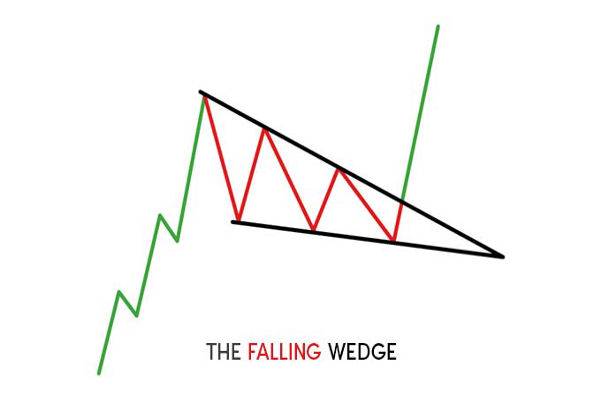
The pattern also differs from a wedge. In a wedge, both boundaries usually slope in the same direction.
The best way to understand the pattern is to watch the struggle inside it.
Imagine EUR/USD rallying to 1.0940 before sellers push it back. The next attempt reaches only 1.0925. Sellers did not wait for the old high. They stepped in earlier.
The pair then drops to 1.0840 and rebounds. On the next pullback, buyers return at 1.0860. They are also becoming more aggressive.
Neither side has taken control. Sellers keep lowering the ceiling. Buyers keep raising the floor.
The candles often become smaller as the triangle develops. Daily or intraday ranges may shrink. Average True Range can also fall. The chart begins to look quiet (which is misleading).
Stops often sit just outside the trendlines. Breakout traders may also place entry orders beyond those levels. When price finally clears one side, those orders can add speed to the move.
Not by itself. A triangle that forms during a strong uptrend may break higher. A triangle in a falling market may continue lower. The previous trend gives traders a starting point, but it does not settle the outcome.
Suppose an index has climbed for several weeks, then begins forming a triangle above its 50-day moving average. The pullbacks remain shallow, and sellers cannot force price below support. An upside break would fit the broader trend.
Now place the same triangle under a major weekly resistance level after a long rally. Price keeps failing near the highs, and momentum has started to weaken. A downside break would carry more weight.
Context changes the reading.
| Market Context | Initial Bias | Confirmation Needed |
|---|---|---|
| Strong established trend | Continuation more likely | Breakout in the trend direction with follow-through |
| Extended move near major support or resistance | Higher reversal risk | Breakout against the prevailing trend with strong momentum |
| Sideways market | No directional bias | Decisive close outside the pattern followed by continued movement |
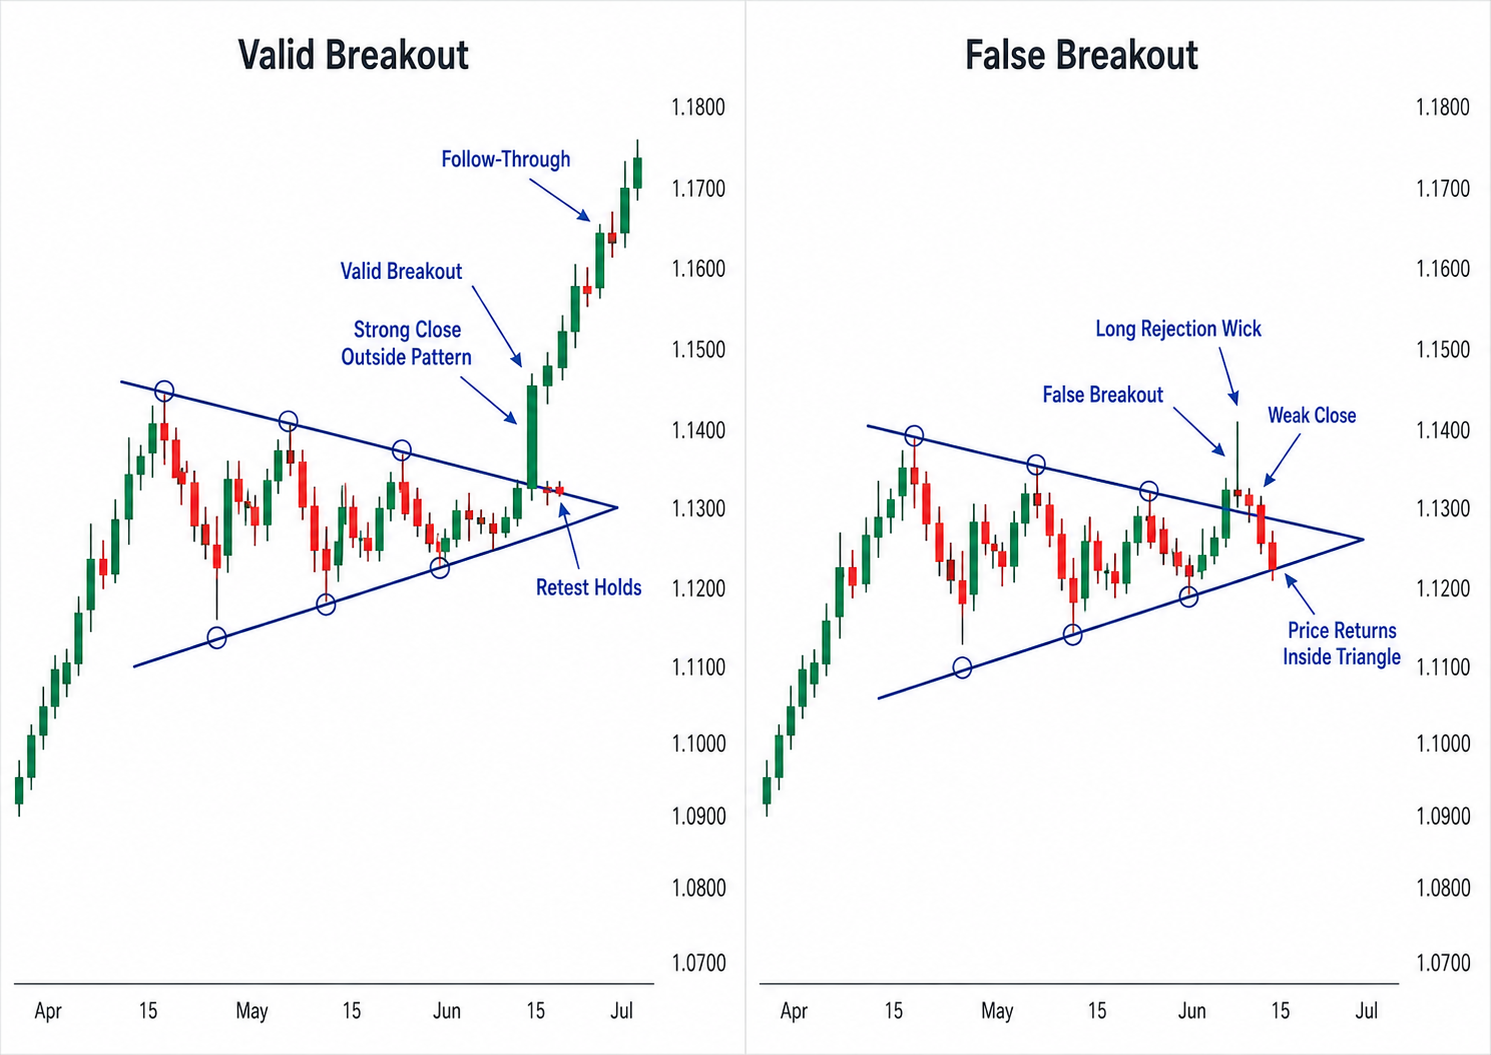
The first question is simple: did price close outside the triangle?
A brief move through the trendline is not enough. Price can trade above resistance during the session, leave a long wick and finish back inside. That is a warning, not a breakout.
Next, look at the candle itself.
A stronger upside break often leaves a wide bullish body and closes near the high. A stronger downside break usually shows the opposite. Weak candles tend to have small bodies or long rejection wicks.
Then compare the breakout candle with the candles inside the pattern. If the triangle has spent ten sessions tightening and the breakout candle is just as small as the rest, the market may not be ready to run.
A real break should look different.
Volume can help. In stocks and exchange-traded markets, traders can compare the breakout with actual trading volume. In spot forex, platforms usually show tick volume, which tracks how often prices change. It is not total global forex volume, but a clear rise can still show that activity has picked up.
The next few candles matter just as much. Price should continue moving away from the triangle or return to the broken line and hold it.
| Confirmation Factor | Stronger Breakout | Possible False Breakout |
|---|---|---|
| Close | Clearly outside the triangle | On or back inside the boundary |
| Candle body | Large and directional | Small or indecisive |
| Wick | Short rejection wick | Long rejection wick |
| Range | Wider than recent candles | Similar to recent candles |
| Trading activity | Increasing | Flat or declining |
| Retest | Holds the breakout level | Falls back inside the pattern |
| Follow-through | Continues in the breakout direction | Quickly reverses |
No single signal proves the breakout will work. Several clues pointing in the same direction make the setup easier to trust.
Timing also affects the quality of the pattern. A breakout that comes before price reaches the apex usually tells traders more. One side has pushed through while the range still had room to tighten.
A move very close to the apex can be less convincing. At that stage, price may drift outside simply because the two lines have almost met.
A breakout that comes too early can also be questionable. The structure may not have formed long enough to represent a genuine period of compression.
There is no perfect breakout point. Traders should look for a developed pattern followed by a clear change in candle range and momentum.
There are three common ways to enter.
The fastest approach is to enter when price crosses the trendline. This gives the earliest price and the largest potential move. It also carries the greatest risk of buying a wick above resistance or selling a brief move below support.
A more patient trader waits for the breakout candle to finish. The entry may be less attractive, especially after a large candle, but the chart has at least shown that price could stay outside the triangle until the close.
The third approach is to wait for price to return to the broken trendline. After an upside break, old resistance should act as support. After a downside break, old support should hold as resistance.
A clean rejection can offer a better entry and a clearer place for the stop. Some breakouts never retest, so this method can also leave traders watching the move without them.
| Entry Method | Main Advantage | Main Drawback |
|---|---|---|
| Immediate breakout | Earliest possible entry | Highest risk of a false breakout |
| Candle close | Greater confirmation | Less favourable entry price |
| Retest | Clearer invalidation level | Retest may never occur |
The stop should reflect why the idea would be wrong. For an upside breakout, that may mean placing it below the retest low, below the breakout candle or beyond the opposite side of the triangle. For a downside break, the same logic applies in reverse.
A stop placed just inside the pattern may be too tight. Price often checks the broken line before moving.
The wider the stop, the smaller the position should be. Risk should not increase simply because the chart requires more room.
The usual target is at the widest point of the triangle. Suppose the pattern is 100 points high and price breaks upward at 2,500. The full measured target would be 2,600.
That number is a guide. If resistance sits at 2,560, traders may take some profit there rather than wait for the full projection. Previous highs, lows and round numbers can all interrupt the move.
A practical plan might use:
The nearest price level as the first target
Half the triangle height as the second
The full measured move as the final target
Consider an illustrative EUR/USD four-hour chart. The first high forms near 1.0940. The next two rallies stall at 1.0925 and 1.0910. On the downside, price rebounds from 1.0840, then 1.0860 and 1.0875.
By the final swing, the candles are noticeably smaller. Price is trapped in a tight range. Then a bullish candle pushes through the upper trendline. It does not leave a long upper wick. It closes at 1.0918, near the top of its range.
The next candle pulls back towards 1.0905. Sellers try to push price under the old trendline, but the candle closes above it. Buyers have defended the retest.
That is what traders want to see: not just a line being crossed, but price staying above it.
| Indicator | Example | Interpretation |
|---|---|---|
| RSI | 58 and rising | Momentum improving |
| MACD | Histogram expanding above zero | Bullish momentum strengthening |
| 20 EMA | Price above | Short-term trend remains bullish |
| 50 EMA | Price above | Medium-term trend supports the breakout |
| 200 EMA | Price above | Long-term trend remains bullish |
| Support | 1.0905 | Potential retest level |
| Resistance | 1.0980 | First likely resistance area |
| Momentum | Expanding | Breakout gaining strength |
The numbers are illustrative, but the sequence is realistic. Compression comes first. The break follows. The retest shows whether the new level can hold.
False breaks often reveal themselves quickly. Price may spike above resistance, leave a long wick and close back inside. It may close outside, then reverse on the next candle. It may also break, retest the line and fail to hold it.
News can make the move more violent. A central-bank decision or inflation release may push price beyond the triangle before the market settles in the opposite direction.
Late breaks near the apex also deserve caution. A slow drift through the trendline is not the same as a forceful breakout.
Common mistakes include:
Drawing trendlines through weak or random swings
Entering before the candle closes
Assuming the old trend guarantees the new move
Ignoring the size and shape of the breakout candle
Treating forex tick volume as total market volume
Placing the stop inside normal retest noise
Chasing price after an oversized breakout candle
Treating the measured target as guaranteed
Price that cannot stay outside the triangle is sending a clear message. The breakout has not worked.
It can break either way. The previous trend may favour continuation, but traders still need to see price close outside the triangle and hold the break.
At least two clear reactions on each trendline are usually needed. The swings should be easy to identify without forcing the lines to fit.
Place it beyond the point that would invalidate the setup. This may be behind the retest swing, the breakout candle or the opposite side of the triangle.
A rise in volume or tick activity can support the move. It works best alongside a strong close, wider range and follow-through.
Measure the widest part of the triangle and project that distance from the breakout point. Check nearby support and resistance before using the full target.
The symmetrical triangle pattern shows a market running out of room. Rallies stop lower. Pullbacks find support sooner. The range tightens until price finally breaks one side.
The shape alone is not the signal. Traders still need to see whether price can close outside, move with force and stay beyond the broken trendline.
A good setup should answer three questions before entry: where is the trade wrong, how much is at risk and where could price reasonably go? The breakout chooses the direction. The plan decides whether the trade is worth taking.