When prices keep climbing and every dip gets bought, traders start asking the same question: “Is this a stock market bubble?”
In 2025, that question is louder than ever. Valuation metrics for major indices are near historic extremes, central banks talk about “stretched” asset prices, and surveys show many professional investors now list an AI bubble as their top market risk.
This guide walks through what a stock market bubble is, how it forms, where we are in 2025, the typical pattern when a bubble bursts, and the key signals traders can watch.
What Is a Stock Market Bubble?

A stock market bubble is a period when share prices move far above what underlying earnings and economic fundamentals can reasonably support.
In simple terms:
Prices rise much faster than profits
Expectations become unrealistic
Buying is driven more by story and fear of missing out than by analysis
Classic features include:
Rapid price increases over months or a few years
Valuation ratios such as price-to-earnings (P/E) or the Shiller CAPE ratio rising far above their long-term averages
Heavy speculative activity, often in a fashionable theme (dot-com, housing, crypto, AI, etc.)
Narratives that dismiss risk, such as “this time is different” or “earnings will catch up later”
A bubble is not just “high prices.” It is a mix of stretched valuations, crowded positioning, and fragile psychology. Prices depend on confidence staying strong. Once confidence cracks, the shift can be sudden.
How a Stock Market Bubble Forms
Bubbles rarely appear out of nowhere. They usually evolve through several overlapping phases:
1. Foundation: Good news and easy money
A new technology, policy shift, or economic upswing creates legitimate growth prospects.
Interest rates are often low, making equities relatively attractive and encouraging risk-taking.
In 2025, for example, large investment flows into artificial intelligence and related infrastructure have boosted growth expectations and equity valuations.
2. Acceleration: Prices outrun fundamentals
During the acceleration phase, prices begin to outrun underlying fundamentals as early gains appear effortless in hindsight, drawing in a broader wave of investors.
Valuations start to stretch beyond historical averages, market leadership concentrates in a narrower group of popular names, and media narratives reinforce the sense of easy momentum.
In today’s market, this pattern is visible in metrics such as the US Shiller CAPE ratio, which is hovering near 40, a level previously reached only during the dot-com peak and the run-up to 1929.
At that valuation, investors are effectively paying forty times average inflation-adjusted earnings for broad market exposure, a clear signal that sentiment is running ahead of fundamentals.
3. Euphoria: FOMO dominates
In the euphoric stage, fear of missing out (FOMO) becomes the dominant driver as retail participation rises and leverage builds across portfolios.
Markets concentrate into crowded trades, with many investors leaning on the same small group of outperforming names or themes. Even as surveys show broad acknowledgement that valuations are stretched, participants continue adding risk to chase the final leg of the rally.
Recent fund manager data highlights this imbalance clearly: a majority view equities as overvalued, while identifying the AI trade as the most heavily crowded position in global markets.
4. Crack and unwind
A stock market bubble typically ends when earnings fail to meet elevated expectations, policy changes take effect, or an external shock rattles a complacent market. Prices begin to slip, and selling can quickly feed on itself.
Liquidity dries up in crowded trades, volatility spikes, and the market turn often feels sudden, even though the underlying vulnerabilities have been building for years.
Key Signals of a Stock Market Bubble
No single indicator can call the top, but a cluster of signals can help traders judge where we are in the cycle.
Watch for:
1. Extreme valuations
Very high P/E, price-to-sales, or CAPE ratios versus long-term averages.
Market value far above historical ranges relative to GDP or earnings.
2. Narrow leadership and concentration risk
3. Aggressive sentiment and low cash levels
4. Leverage and speculative activity
Rising margin debt, heavy options speculation, and booming volumes in short-dated contracts.
Rapid inflows into thematic funds linked to the prevailing narrative (for example, AI, clean tech, or frontier themes).
5. Dismissal of risk in narratives
Frequent claims that old valuation metrics “no longer apply.”
Earnings, regulation, and macro risks being downplayed as temporary noise.
The more of these signals flash at the same time, the more traders should treat the environment as bubble-prone, even if the exact peak cannot be known in advance.
Are We in a Stock Market Bubble Right Now?
As of late 2025, bubble-like features are visible in parts of the market, but not every asset or region is in the same place in the cycle.
1. Valuations are historically stretched in major US indices.
Long-term metrics such as the Shiller CAPE ratio are around 40, well above their historical median near 16 and close to dot-com highs.
2. Official institutions are warning about “stretched” valuations.
Recent global financial stability assessments highlight elevated stock and credit prices, along with the risk that concentrated gains in mega-cap AI-related names could reverse sharply if expectations fail to materialize.
3. AI is the focal point of bubble fears.
Central banks have explicitly flagged fast-rising valuations in AI-exposed technology companies as a vulnerability, and professional surveys show an “AI bubble” is now viewed as the top tail risk by many fund managers.
4. Recent pullbacks have been linked to these concerns.
Several market sell-offs in October and November 2025 have been tied to worries that the AI-driven rally has gone too far, too fast.
Does that mean we are definitely in a stock market bubble? Parts of the market, especially large AI and tech leaders, exhibit classic late-cycle symptoms.
In other sectors, regions, or value-oriented equities look less extreme and may still be priced on more traditional fundamentals.
For traders, the key is not to label the entire world “a bubble,” but to recognize that risk is not evenly distributed. Bubble risk is highest where valuations, concentration, and optimism overlap.
What Happens When a Stock Market Bubble Bursts?
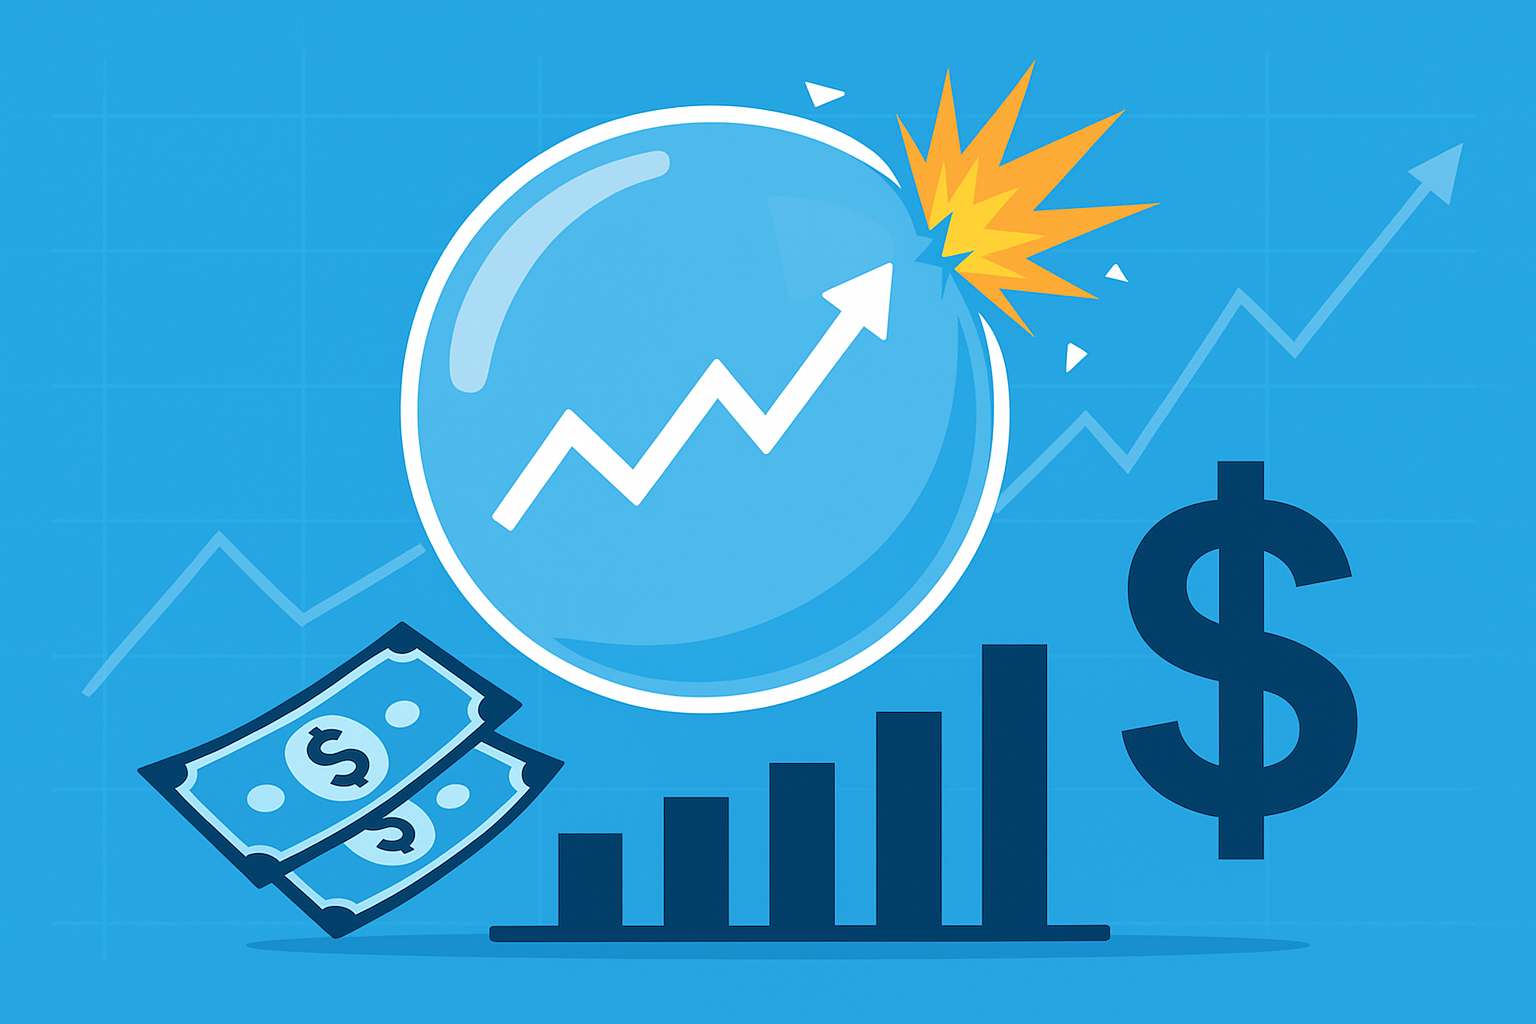
When a bubble unwinds, the pattern is often similar, even if the trigger differs.
1. Phase one: Sharp repricing
When a market bubble breaks, the sequence is usually predictable even if the catalyst varies. The first stage is a rapid repricing, driven by shocks such as earnings misses, policy changes, or geopolitical events.
Crowded positions fall hardest as investors scramble for the exit, liquidity thins, spreads widen, correlations rise, and volatility spikes trigger margin pressure across leveraged accounts.
2. Phase two: Forced selling and liquidation
If the decline extends, the second stage sets in: forced selling. Leveraged traders are pushed to liquidate regardless of fundamentals, and volatility-sensitive systematic strategies can accelerate the downside.
Intraday swings, price gaps, and disorderly moves become common, often dragging high-quality names well below intrinsic value.
3. Phase three: Differentiation and rebuilding
The final stage is differentiation. Markets start to separate winners from the excesses of the prior cycle.
Speculative names rarely revisit their peaks, while fundamentally strong companies with solid earnings and balance sheets stabilize first.
Major indices take far longer to recover than individual leaders, but the period after the shakeout typically presents attractive entry points for investors who protected capital and maintained disciplined risk controls.
How Traders Can Navigate a Potential Bubble
From EBC’s perspective, traders do not need to “call the top” to trade intelligently in a bubble-like environment. Practical steps include:
Balance exposure. Blend high-growth themes with more defensive sectors, quality factors, or non-correlated assets such as certain commodities or currencies, depending on your strategy and risk profile.
All of this remains general information, not personal investment advice. Individual decisions should always reflect your objectives, risk tolerance, and, if needed, professional guidance.
Frequently Asked Questions (FAQ)
1. Is every strong bull market a stock market bubble?
No. A bull market becomes a bubble only when prices rise far beyond what fundamentals justify and speculation takes over.
2. Can a stock market bubble last for years?
Yes. Easy liquidity and strong narratives can keep valuations stretched much longer than expected, which makes timing the peak unreliable.
3. Are we guaranteed to see a crash if valuations are this high?
No. High valuations raise risk but don’t guarantee a crash. Markets can correct through sideways trading or earnings catching up.
4. How can I protect my trading account if I suspect a bubble?
Use less leverage, avoid concentrated positions, keep stops in place, diversify, and hold some liquid capital for volatility.
5. Should I sell everything if I think the market is in a bubble?
Not usually. A full exit is a timing bet. Gradually reducing exposure or rotating into stronger names is typically more practical.
Conclusion
In 2025, talk of a “stock market bubble” is intensifying for valid reasons: valuations in certain sectors are at rare extremes, macro risks are elevated, and official bodies warn of a potential disorderly correction.
Yet, successful traders do not react to the label itself, they focus on the signals. They assess how stretched valuations are, how crowded a trade or theme has become, and how exposed their accounts would be if volatility spikes overnight.
Bubble warnings should foster discipline, not fear. Understanding how a bubble forms and the typical patterns when it bursts allows traders to make structured decisions based on risk, time horizon, and strategy.
Viewed this way, the concept of a bubble becomes a manageable risk factor rather than a frightening headline.
Disclaimer: This material is for general information purposes only and is not intended as (and should not be considered to be) financial, investment or other advice on which reliance should be placed. No opinion given in the material constitutes a recommendation by EBC or the author that any particular investment, security, transaction or investment strategy is suitable for any specific person.


