Published on: 2025-07-09
Updated on: 2025-09-26
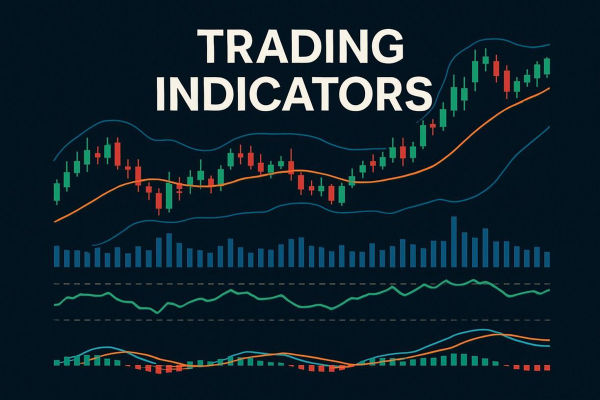
Stock market trading is part science, part psychology, and part data interpretation. For traders aiming to stay ahead of the curve, indicators play a crucial role. These tools help identify trends, measure momentum, spot entry and exit points, and manage risk.
In 2025, despite the emergence of AI-driven analytics and algorithmic tools, traditional technical indicators continue as the backbone of many trading strategies.
This guide breaks down the top 10 stock market indicators every trader should know, how they work, when to use them, and how they can strengthen your trading decisions.

Moving averages are foundational in technical analysis. They smooth out price data over a period, helping traders see the underlying trend more clearly.
The two most commonly used types are:
Simple Moving Average (SMA) – an average of closing prices over a defined period.
Exponential Moving Average (EMA) – gives more weight to recent prices, making it more responsive to new data.
Traders often use MA crossovers (e.g., 50-day crossing above 200-day) to signal potential entries or trend reversals.
In volatile markets, the EMA is often preferred because of its quicker reaction to price movements. Traders use several moving averages to create dynamic support and resistance levels as well as trend confirmation indicators.
A swing trader notices that the 50-day moving average (MA) of Apple Inc. (AAPL) is about to cross above the 200-day MA—a golden cross. This crossover signals a potential long-term uptrend. The trader enters a long position and uses the 50-day MA as a dynamic trailing stop.
RSI is a momentum oscillator that measures the speed and change of price movements, ranging from 0 to 100. It is typically used to identify overbought or oversold conditions.
A reading above 70 often signals that a stock is overbought and may be due for a pullback, while a reading below 30 suggests oversold conditions and potential upside.
More advanced traders also look for RSI divergence—where the price makes a new high or low, but the RSI does not—indicating a possible reversal.
A day trader sees that Tesla (TSLA) stock has an RSI of 82 after several days of gains. Believing it's overbought, the trader short-sells the stock for a quick pullback trade, setting a target at 60 and a stop-loss at 90.
MACD is both a trend-following and momentum indicator. It's calculated by subtracting the 26-period EMA from the 12-period EMA. The result is the MACD line. A 9-period EMA of the MACD line is then plotted to create the signal line.
When the MACD crosses above the signal line, it suggests bullish momentum. When it crosses below, it signals bearish momentum.
MACD histograms visualise the difference between the MACD and the signal line, making it easier to detect shifts in market momentum. It's popular for timing entries and exits in trending markets.
While analysing the S&P 500 ETF (SPY), a trader sees the MACD line crossing above the signal line, accompanied by increasing histogram bars. It confirms bullish momentum, so they open a long position aiming to ride the upward wave until the next crossover.
Developed by John Bollinger, Bollinger Bands consist of a moving average (typically 20-day SMA) and two standard deviation lines (upper and lower bands).
These bands expand and contract according to market volatility. When price touches the upper band, it's considered overbought. When it hits the lower band, it may be oversold.
In periods of low volatility, Bollinger Bands contract—a possible signal of an upcoming breakout. The "squeeze" setup is one of the most commonly used Bollinger strategies.
A range-bound stock such as Coca-Cola (KO) touches the lower Bollinger Band on low volume. A trader buys anticipating a reversion to the mean (the middle band), and sells when the price nears the upper band.

Volume isn't just a number—it's a story about participation and conviction. It indicates the number of shares or contracts exchanged within a specific timeframe. High volume on a breakout suggests the move is genuine. Low volume may indicate a lack of conviction.
Volume analysis is also used to confirm patterns such as breakouts, support and resistance levels, and trend reversals. For instance, increasing prices accompanied by rising volume often suggest strength, whereas increasing prices and dwindling volume may point to a weakening trend.
Modern tools such as On-Balance Volume (OBV) and Volume Profile further enhance traders' interpretation of market participation.
A breakout trader watches Netflix (NFLX) consolidate for weeks. When it finally breaks resistance with a massive spike in volume, they interpret it as a strong breakout and enter a long position with high confidence.
Fibonacci retracement levels help traders identify possible reversal points by plotting horizontal lines at key percentages of a prior move, typically 23.6%, 38.2%, 50%, 61.8%, and 78.6%.
These levels serve as psychological support and resistance areas where traders anticipate the price will pull back before continuing the main trend.
When combined with candlestick patterns or moving averages, Fibonacci retracements can help plan entry points or set stop-loss levels.
After Nvidia (NVDA) surges from $400 to $500, a trader waits for a retracement. They identify the 38.2% level at $461 and enter a buy order there, expecting the uptrend to continue after the pullback.
It is another momentum indicator that assesses a specific closing price of a stock against a range of its prices over a defined timeframe, typically 14 days.
The stochastic oscillator produces values between 0 and 100. Readings above 80 typically indicate overbought conditions, and readings under 20 suggest oversold.
Traders use %K and %D line crossovers for entry and exit signals. It works particularly well in range-bound markets. When used with volume and moving averages, the stochastic oscillator helps confirm signals and filter out noise.
A trader sees that Meta Platforms (META) is in a sideways market. The stochastic oscillator drops below 20, signalling oversold conditions. When it crosses above 20, the trader opens a long position, targeting resistance at the top of the range.
ATR is a measure of volatility, not direction. It shows the degree of price fluctuation over a specific period, usually 14 days.
Higher ATR values indicate more volatile markets, while lower values suggest calmer markets. It's useful for setting stop-loss orders based on market conditions.
Instead of making assumptions, traders employ ATR to determine flexible position sizing and to assess the amount of risk to assume for each trade. For instance, a close stop in a high-ATR setting might easily be triggered, making ATR-adjusted stops more feasible.
A risk-focused trader is about to open a position in Amazon (AMZN). The daily ATR is $4. They size their position so that a stop-loss 1.5x ATR below the entry won't risk more than 2% of their capital.

Parabolic SAR places dots above or below price bars, indicating the direction of the trend and potential reversal points. When dots are below the price, it's a bullish signal. When they appear above the price, it suggests a downtrend.
It is especially beneficial for setting trailing stop-loss orders and implementing trend-following tactics. Nevertheless, it performs optimally in trending markets and may provide misleading signals in volatile or sideways situations.
Pairing Parabolic SAR with indicators like RSI or MACD can improve accuracy and timing.
A momentum trader uses Parabolic SAR while trading the Dow Jones Industrial Average (DJIA). As the price trends upward, SAR dots remain below the price. When a dot finally appears above the price, the trader exits the position, locking in profits before a reversal.
Though more complex than most indicators, Ichimoku Cloud offers a comprehensive view of trend, momentum, and potential support/resistance areas—all in one chart.
It includes five lines: Tenkan-sen, Kijun-sen, Senkou Span A & B (forming the cloud), and Chikou Span.
When the price is above the cloud, it's generally considered bullish. If it's below, it's bearish. When the cloud is thick, it signals strong support or resistance.
Many traders use Ichimoku to spot breakout confirmations and align it with longer-term trends for stronger conviction.
A trend trader analyses Microsoft (MSFT). The price is above the cloud, Tenkan-sen is above Kijun-sen, and Chikou Span is also above the price. With all signals aligned, the trader goes long and uses the lower part of the cloud as a dynamic stop-loss level.
No indicator is perfect alone. Smart traders combine multiple indicators to reduce false signals and confirm entries and exits.
A classic combo might look like:
Use Moving Averages to identify trend direction
Use RSI or Stochastic Oscillator to find momentum
Confirm breakouts with Volume or MACD
Avoid using too many indicators with similar functions, as it leads to redundancy and analysis paralysis.

The answer depends on your trading style. Here's a quick guideline:
Trend traders prefer moving averages, MACD, and Ichimoku Cloud
Swing traders use RSI, Fibonacci retracements, and Bollinger Bands
Day traders rely on volume, stochastic, and short-period EMAs
Scalpers may use ATR and Parabolic SAR for precise stops
Backtest different combinations and stick with what suits your psychology, market focus, and risk appetite.
In conclusion, continue to rely on conventional indicators as they provide clarity, context, and organisation. The top 10 indicators mentioned above have stood the test of time. From RSI and MACD to Ichimoku and Fibonacci, each serves a distinct purpose.
Whether you're a beginner or aiming to improve your abilities, incorporating these indicators into your toolkit can boost your precision, self-assurance, and outcomes. Remember: indicators assist, but discipline, strategy, and risk management win the game.
Disclaimer: This material is for general information purposes only and is not intended as (and should not be considered to be) financial, investment or other advice on which reliance should be placed. No opinion given in the material constitutes a recommendation by EBC or the author that any particular investment, security, transaction or investment strategy is suitable for any specific person.