Published on: 2025-03-20
Updated on: 2026-07-06
The Morning Star pattern is a bullish reversal candlestick setup that appears after a decline and signals that selling pressure may be weakening. Its reliability depends on trend context, support levels and market conditions than on the three candles themselves.
A Morning Star on the hourly chart, within a strong weekly downtrend, carries a very different risk from a daily Morning Star forming at monthly support. The pattern can help traders identify a possible turning point, but only when structure, confirmation and risk management support the trade.
The Morning Star pattern is a three-candle bullish reversal setup, not a standalone buy signal.
The strongest setups form after a clear decline near support or a demand zone.
Higher-timeframe context matters. Patterns that run counter to the broader trend fail more often.
Entry strategies should match trader risk tolerance: aggressive, standard or conservative.
A failed Morning Star is confirmed when price breaks below the pattern low.
Exits should be planned around resistance, risk-reward and invalidation, not hope.
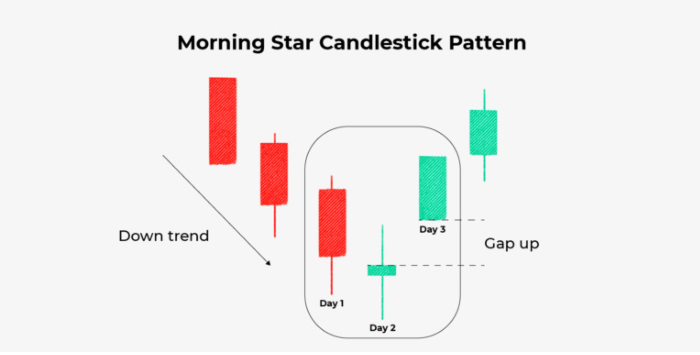
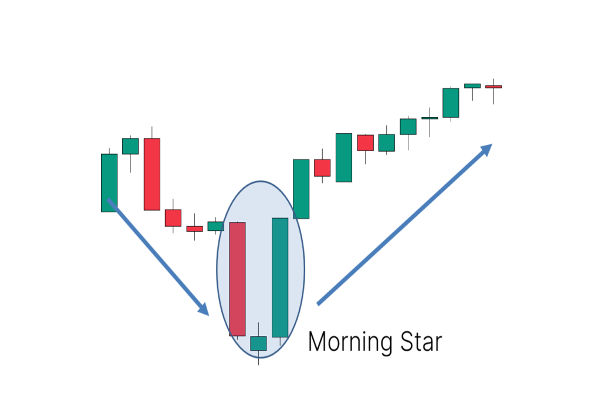
The Morning Star pattern has three candles. The first is a strong bearish candle that confirms seller control. The second is a small-bodied candle that shows hesitation. The third is a bullish candle that confirms buyers have stepped in.
| Candle | Structure | What It Shows |
|---|---|---|
| Candle 1 | Large bearish candle | Sellers still control the market |
| Candle 2 | Small body, doji, or spinning top | Selling pressure stops being rewarded |
| Candle 3 | Strong bullish candle | Buyers regain control and force late sellers to cover |
The third candle should ideally close above the midpoint of the first candle. A weak third candle with a long upper wick is less convincing because buyers failed to hold the advance.
In stock charts, gaps between candles can make the pattern visually cleaner. In forex and CFD markets, visible gaps are less common, so traders should focus on shifts in structure: strong selling, loss of downside momentum, and then bullish confirmation.
A valid Morning Star pattern must appear in the right location. Three candles alone are not enough.
The pattern works best after a sustained decline or a meaningful pullback into support. It becomes weaker when it appears in the middle of a sideways range or directly below resistance.
A higher-quality setup usually includes:
A clear decline before the pattern forms.
A first candle with strong bearish range.
A second candle that shows real hesitation.
A third candle that closes strongly into the first candle’s body.
Support, demand or higher-timeframe structure beneath the pattern.
The best traders do not ask only, “Is this a Morning Star?” They ask, “Is this the right place for buyers to defend price?”
The psychology behind the Morning Star pattern is more precise than “sellers lose and buyers win.”
The first candle shows that most participants still believe the downtrend is intact. Sellers are being rewarded for pressing lower. Buyers are either waiting or exiting.
The second candle marks a change. The market stops rewarding fresh selling. Price may push lower, but follow-through fades. Late sellers enter, yet they do not get the continuation they expected.
The third candle creates the pressure point. Short-term sellers who entered late become trapped as price rises against them. Their covering turns them into buyers, while new buyers enter on confirmation. That feedback loop can accelerate the reversal, especially if it occurs at support.
Confirmation should begin with market structure, not indicators. RSI and MACD can help, but they should not lead the decision.
| Confirmation Factor | Importance | What Traders Look For |
|---|---|---|
| Support or Demand Zone | Highest | Pattern forms where buyers previously defended price |
| Higher-Timeframe Trend | Highest | Setup aligns with broader structure or major support |
| Market Structure | High | Price breaks a lower-high sequence or reclaims a key level |
| Momentum | Medium | Bearish pressure slows before the third candle forms |
| RSI or MACD | Supporting | RSI exits oversold or MACD momentum improves |
| Volume or Range Expansion | Supporting | Third candle shows stronger participation |
A Morning Star against the higher-timeframe trend needs stronger confirmation. For example, an H1 Morning Star inside a weekly downtrend may only produce a short bounce. A daily Morning Star forming at monthly support can carry more weight because it aligns with a broader demand zone.
In forex, traders should treat volume carefully because centralised volume is limited. Tick volume, candle range and session timing can offer better context than a simple volume reading.
There is no single “best” entry strategy. The best entry depends on confirmation, volatility, timeframe, and the trader's risk tolerance.
Many traders use the Morning Star pattern on H1, H4 and daily charts because higher timeframes generally produce fewer but more reliable signals.
An aggressive trader enters when price breaks above the high of the second candle or during the formation of the third candle. This captures an earlier price, but the risk is clear: the candle may reverse before the close.
This method works only when the pattern forms at strong support and momentum shifts quickly.
The standard entry comes after the third candle closes. This is the cleanest method for most traders because the reversal has been confirmed.
A common rule is to enter at the next candle open if the third candle closes above the midpoint of the first candle. This avoids buying the indecision candle.
The conservative entry waits for price to pull back after confirmation. Traders may look for a retest of the third candle’s midpoint, a broken minor resistance level or a short-term moving average.
The benefit is a better risk-to-reward profile. The drawback is that strong reversals may not offer a retest.
The pattern is invalidated if price breaks below the lowest point of the three-candle structure. That area should guide stop-loss placement.
A basic stop sits below the pattern low. In volatile markets, a small ATR-based buffer can prevent normal noise from triggering an early exit. For example, if the pattern low sits at 1.2500 and ATR(14) is 20 pips, a trader might place the stop at 1.2485 rather than directly below the low.
Position size should adjust to the stop distance. A wider stop requires smaller size. The goal is to keep account risk stable, not to force every setup into the same position size.
The first exit target should be the nearest resistance level. This may be a previous swing high, a supply zone, a moving average or a pivot level.
A second method is a fixed risk-reward target. If the entry-to-stop distance is 40 pips, a 1:2 target would aim for 80 pips. This keeps the trade objective before emotion enters.
Partial exits can improve trade management. Traders may take profit at the first resistance level, then move the remaining stop to break even. If momentum continues, the final portion can trail below higher lows or a short-term EMA.
For short sellers, a confirmed Morning Star near support is a warning. It may be a reason to close shorts, reduce exposure or tighten stops.
Most Morning Star patterns fail when market context is weak. Failure does not mean the pattern is useless. It means the three candles were not strong enough to overcome the broader market structure.
A Morning Star often fails when the third candle closes weakly, resistance sits immediately overhead, the broader trend remains strongly bearish, or high-impact news reverses sentiment.
The clearest failure signal is a break below the pattern low, followed by confirmation. Once price trades below that level, the bullish thesis is invalidated. Traders should exit rather than wait for the pattern to “work later.”
Studying failed Morning Stars is as important as studying successful ones. The failure point defines risk and prevents a small reversal trade from becoming a large loss.
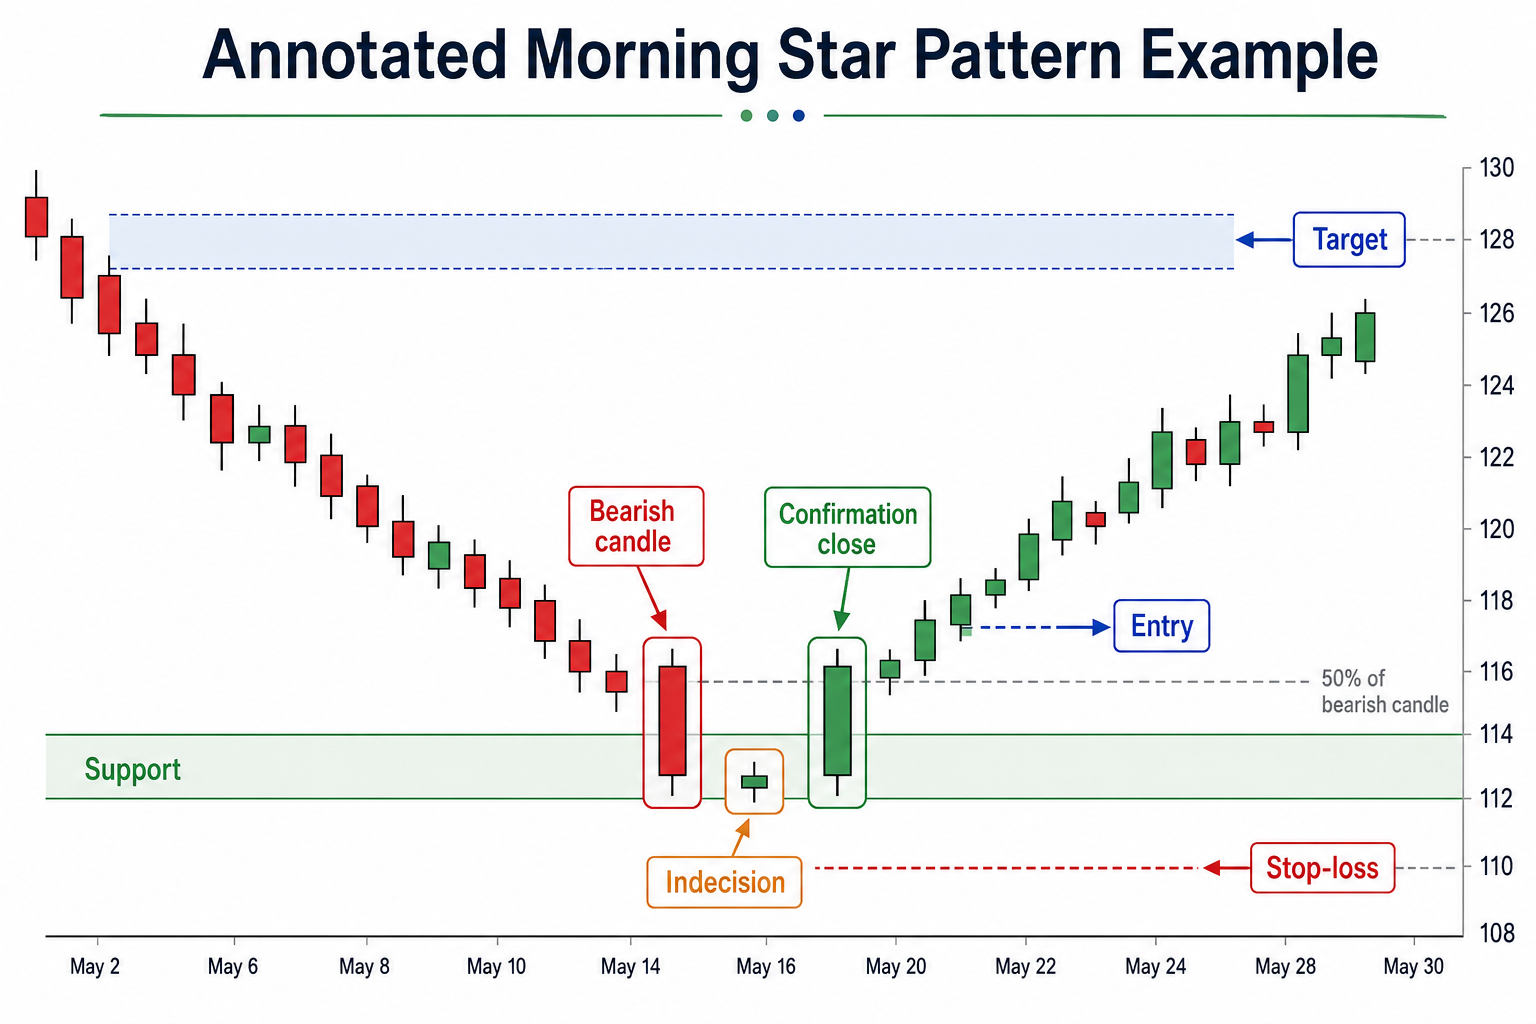 A strong chart example should show the full decision sequence, not only the three candles.
| Label | Chart Annotation | Trading Meaning |
|---|---|---|
| A | Price declines into support | Buyers have a logical area to defend |
| B | Large bearish candle forms | Sellers remain confident |
| C | Small indecision candle appears | Downside pressure stalls |
| D | Bullish candle closes above the midpoint of candle one | Confirmation improves |
| E | Entry after the confirmation close | Trader avoids premature entry |
| F | Stop-loss below the pattern low | Invalidation is defined |
| G | Target near previous resistance | Exit is p |
The image should make the trade logic obvious: location first, confirmation second, entry third, risk fourth and exit last.
The first mistake is entering before confirmation. The second candle may look like a reversal is forming, but it only shows hesitation. Without a strong third candle, the setup remains incomplete.
The second mistake is ignoring location. A Morning Star near support has more value than one that appears in the middle of a range.
The third mistake is trading against a dominant higher-timeframe trend without stronger evidence. A small reversal signal can be overwhelmed by larger market structure.
The fourth mistake is placing stops too tightly. If volatility is high, a stop directly below the candle low may be triggered before the trade has enough room to develop.
The fifth mistake is expecting every Morning Star to start a trend. Some patterns only produce short-term rebounds. Nearby resistance should always shape the exit plan.
It can be useful, but it is not reliable on its own. The pattern works best near support, with higher-timeframe alignment and strong confirmation. It fails more often when traded against dominant market structure.
The strongest confirmation is a bullish third candle closing above the midpoint of the first candle. Support, higher-timeframe context, structure shift, improving momentum and volume expansion can add confidence.
A common stop-loss is placed below the lowest point of the three-candle pattern. In volatile markets, traders may add a small ATR buffer below that level.
The standard entry after the third candle closes is usually the most balanced. Aggressive entries offer earlier pricing but higher failure risk. Conservative entries offer better risk control but may miss fast reversals.
Yes. It can be used in forex, commodities, stocks and indices. In forex, traders should focus less on visible gaps and more on structure, session liquidity, momentum and confirmation.
The Morning Star pattern is useful because it shows a visible shift from seller control to buyer recovery. Its weakness is that traders often treat it as a prediction instead of a conditional setup.
The strongest trades come from the right context: clear prior decline, meaningful support, higher-timeframe awareness, strong confirmation and defined invalidation. Entry identifies opportunity. Exit discipline determines whether the opportunity becomes profit.
Disclaimer: This material is for general information purposes only and is not intended as (and should not be considered to be) financial, investment or other advice on which reliance should be placed. No opinion given in the material constitutes a recommendation by EBC or the author that any particular investment, security, transaction or investment strategy is suitable for any specific person.