Published on: 2025-07-24
Updated on: 2025-07-24
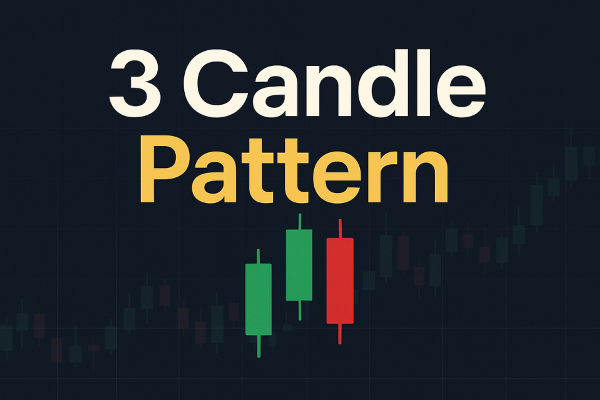
In trading, pattern recognition remains one of the most powerful tools for forecasting price movements. Among various price action setups, the 3 Candle Pattern stands out due to its straightforwardness, dependability, and adaptability across different markets.
Whether you're a beginner just learning to read candlesticks or a seasoned trader looking to refine your strategy, mastering the 3 Candle Pattern can add clarity and precision to your entries and exits.
In this guide, we'll explore the 3 Candle Pattern by explaining what it is, outlining its key types, showing you how to identify and confirm the setup effectively, providing practical trading strategies, and essential risk management tips.

The 3 Candle Pattern refers to a group of candlestick formations that involve three successive candles. These patterns signal a reversal or continuation of a trend, depending on the structure and market context.
In contrast to single candlestick patterns (Doji) or two-candle patterns (engulfing), the three-candle pattern offers greater confirmation, helping traders avoid false signals.
The most well-known 3 candle formations include:
Three White Soldiers
Morning Star
Evening Star
Three Inside Up/Down
These can appear at key market turning points or during consolidation before a trend resumes.

Description:
This pattern appears following a downtrend and consists of three long bullish candles, with each closing above the previous.
Characteristics:
All three candles have small or no wicks
Each opens within the previous candle's body
Consistent upward momentum
Signal:
Strong bullish reversal, especially when volume increases or when forming near a support zone.
Strategy:
Entry: After the close of the third candle
Stop-loss: Below the first candle's low
Take-profit: Use a 1:2 risk-reward or the next resistance level
Description:
It serves as the negative equivalent of the Three White Soldiers. It appears after an uptrend and consists of three long bearish candles closing progressively lower.
Characteristics:
Each candle opens within the previous candle's body
Lower closes indicate strong bearish momentum
Small wicks suggest dominance by sellers
Signal:
Bearish reversal, especially pronounced near resistance levels or following prolonged uptrends.
Strategy:
Entry: After the third candle closes
Stop-loss: Above the first candle's high
Take-profit: Target recent support zones
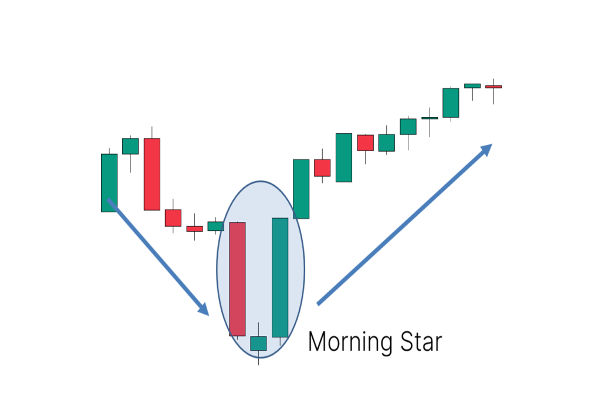
Description:
The Morning Star is a classic bottom reversal setup with three distinct candles:
First candle: Large bearish
Second candle: Small body (Doji/spinning top), showing indecision
Third candle: Large bullish candle closing above the midpoint of the first candle
Signal:
Indicates sellers are losing control, and buyers are stepping in.
Strategy:
Entry: After the third candle closes
Stop-loss: Below the lowest point of the pattern
Confirmation: RSI divergence or support zone strengthens the signal
Description:
This pattern is the opposite of the Morning Star and occurs at market tops:
First candle: Strong bullish candle
Second candle: Indecision (Doji/spinning top)
Third candle: Bearish candle closing below the midpoint of the first candle
Signal:
Momentum transitions from bulls to bears, indicating a change in trend.
Strategy:
Entry: After confirmation of the third candle
Stop-loss: Above the pattern's high
Risk management: Avoid entries in strong uptrends unless confirmed with indicators
Three Inside Up (Bullish):
Candle 1: Large bearish candle
Candle 2: Smaller bullish candle (inside the first)
Candle 3: Bullish candle closing above the first
Three Inside Down (Bearish):
Candle 1: Large bullish candle
Candle 2: Small bearish candle (inside the first)
Candle 3: Bearish candle closing below the first
Signal:
A sudden move followed by a momentum reversal often indicates a correction or shift in trend.

To recognise these setups accurately:
Use candlestick charts, not line or bar charts
Look for the patterns near support/resistance, trendlines, or moving averages
Check for volume spikes to validate conviction
Avoid trading them in choppy or sideways markets
3 Candle Pattern Across Timeframes
| Timeframe | Best Use | Notes |
|---|---|---|
| 1-min / 5-min | Scalping setups | May need confirmation with indicators |
| 15-min / 1H | Intraday trading | Combine with S/R or VWAP for consistency |
| 4H / Daily | Swing trading or position entries | Stronger reliability, less market noise |
| Weekly | Long-term trend reversal or breakout | Very powerful when combined with fundamentals |
Ideal Conditions:
Clear prior trend
Clean candle bodies with minimal wicks
Appears near known price zones
Confirmation from RSI, MACD, or momentum indicators
| Rule | Why It Matters |
|---|---|
| Use a stop-loss beyond pattern | Protects against false breakouts |
| Risk 1–2% of capital per trade | Maintains account longevity |
| Use a trading journal | Tracks win rate and pattern effectiveness |
| Avoid overtrading the pattern | Not all 3 candle setups are high quality |
| Combine with trend filters | Only trade bullish patterns in uptrends, bearish in downtrends |
As for common rookie mistakes, here are what beginners should look out for:
Ignoring market context: Don't trade the pattern without trend analysis
Entering too early: Always wait for the third candle to close
No confirmation: Combine with other tools for a higher probability
Improper risk management: Always use stop-losses and position sizing
In conclusion, the 3 Candle Pattern is more than just a visual formation; it's a window into market sentiment and price psychology. Whether signalling a reversal like the Morning Star or confirming bearish momentum with Three Black Crows, these patterns offer high-probability setups across all markets.
Therefore, to trade the 3 Candle Pattern successfully, it's essential to understand its structure and the broader market context, use confluence with other indicators for stronger signals, apply disciplined risk management, and study real chart examples for practical insight.
Disclaimer: This material is for general information purposes only and is not intended as (and should not be considered to be) financial, investment or other advice on which reliance should be placed. No opinion given in the material constitutes a recommendation by EBC or the author that any particular investment, security, transaction or investment strategy is suitable for any specific person.