Published on: 2025-10-15
Updated on: 2025-10-15
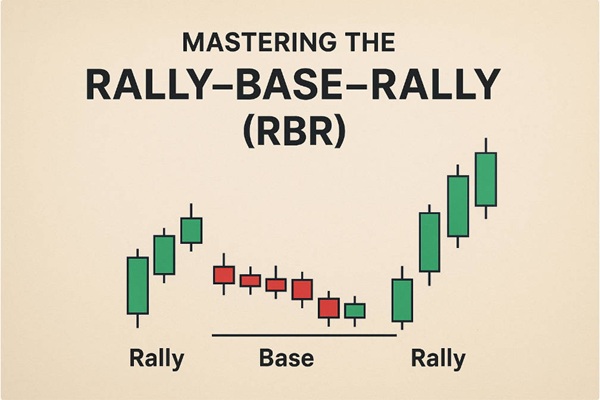
The Rally–Base–Rally (RBR) pattern is a simple but powerful price-action structure used by traders who study supply and demand. At its core, RBR describes how price advances, pauses, and then resumes the advance — forming a demand zone that can be traded with defined risk.
This article explains the pattern, the market mechanics behind it, how to identify high-probability RBR zones, practical entry/exit rules, common traps, and how to apply the concept across timeframes and asset classes.

Definition. An RBR is a three-phase price structure:
Rally: a clear impulsive upward move (a surge of buying).
Base: a period of consolidation — narrow range candles and reduced volatility where price pauses.
Rally (again): a renewed impulsive move upward that confirms the base as a demand area.
When a clean RBR forms, the base commonly marks a demand zone where orders accumulated during the pause can act as support on later retests. Traders therefore treat the base as a potential area to buy with a logical stop below the zone.

Institutional behaviour. Large participants (institutions, funds) often create strong moves, then pause to allow smaller participants to enter or to absorb liquidity. That pause — the base — is frequently where institutional orders remain unfilled and where new buy orders accumulate. When buying resumes, the structure appears as a second rally.
Imbalance of supply and demand. The initial rally indicates buyers temporarily overwhelm sellers. The base represents a short-lived equilibrium; the second rally shows buyers again dominating supply, which produces momentum.
Liquidity pooling. The base often collects stop orders and resting limit orders; when price returns to that zone, these orders provide the depth that fuels the next leg.
Use the following checklist when you spot a possible RBR. The more criteria that match, the stronger the setup.
| Identification checklist | Why it matters |
|---|---|
| Clear initial rally — strong impulsive candles or a swift slope | Shows genuine buying pressure rather than slow drift. |
| Distinct base — narrow range, small bodies, low volatility | Indicates a pause/accumulation rather than noisy choppiness. |
| Short to moderate base duration (not an extended sideways market) | Very long bases often weaken the zone's predictiveness. |
| Volume profile — lower volume during base, pick-up on the breakout/re-rally | Volume confirms institutional re-engagement. |
| Context — aligns with higher-timeframe uptrend or support | Pattern in trend has a higher probability of continuation. |
| Orderly structure — no intervening opposite-direction structure (e.g. RBD) | Ensures the base is a demand zone, not distribution. |

Below are commonly used, practical rules. These can be adapted to your time frame and account size, but they are intentionally conservative so risk is defined.
Wait for price to return to the base (demand zone) and place a buy limit or a buy stop just above the first strong bullish candle that marks the re-rally.
Enter on a clean breakout above the consolidation range with a breakout candle confirmed (optionally require volume spike). This is more aggressive and can give worse risk/reward if you miss the retest.
Scale in — buy partial size on breakout (or first retest) and add on a second, better retest.
Conservative: below the lowest wick of the base (or below the base low).
Tighter: below a micro-structure low inside the base (if you want smaller risk but accept the chance of being stopped before a move).
Hard stop: ensure the stop is placed where the structure is invalidated (if price closes convincingly below the base).
Use prior swing highs, measured moves (height of the initial rally projected), or Fibonacci extensions for targets. Aim for a minimum 1.5:1 to 3:1 reward-to-risk depending on your win rate and trade management.
| Parameter | Conservative example | Aggressive example |
|---|---|---|
| Entry | Buy on retest to base | Buy on breakout candle close |
| Stop | 8–12 pips (FX) / 0.5–1% (equities) below base low | 4–6 pips / 0.2–0.5% below micro low |
| Target | Prior swing high / 1.5× risk | Fibonacci 1.618 / 3× risk |
| Position sizing | Risk 0.5–1% account per trade | Risk 1–2% account per trade |
(Adjust sizes and distances to the instrument's volatility.)

Volume and momentum indicators are not mandatory, but they improve probability:
Volume: ideal RBRs show lower volume during the base and higher volume during the second rally/breakout. That indicates orders are being absorbed and then buying resumes.
Momentum (RSI/MACD): look for momentum divergence only as a warning; more often traders want to see momentum confirming the re-rally rather than diverging.
Price action confirmation: a strong bullish engulfing candle or a sequence of impulsive candles on the second rally increases confidence.
RBR is a multi-timeframe concept — and the higher timeframe context matters:
Higher timeframe (daily/weekly): use it to define the overall trend bias and mark larger demand zones. An RBR on a daily chart carries more weight than one on a 15-minute chart.
Lower timeframe (H1/15m): look for precise entries, retests and micro-bases inside the larger zone.
Nested RBRs: it's common to see a daily RBR that contains several smaller RBRs on intraday charts. Aligning entries with higher-timeframe zones improves the odds.
Mistaking noise for a base. If the "base" contains wide, choppy bars or long overlapping candles, it is less likely to be a genuine accumulation. Stick to clear, narrow-range bases.
Trading against the higher-timeframe trend. An intraday RBR in a strong daily downtrend carries lower probability — favour trades that align with higher-timeframe bias.
Ignoring volume. A re-rally with muted volume is more likely to fail; treat volume spikes during the second rally as confirmation.
Over-optimistic stops. Placing the stop too tight inside structural noise invites early exits; place stops where structure is invalidated.

Forex: RBR zones are frequent and can offer tight risk if you align with market sessions and currency volatility. Use Average True Range (ATR) to size stops sensibly.
Equities: RBRs on daily charts can mark institutional accumulation; volume is often a clearer confirmation here.
Commodities & Crypto: higher volatility can produce fast RBRs and false breakouts — favour retest entries and wider stops.
Confluence with moving averages: a base formed near a rising 50-period EMA in an uptrend offers additional support.
Fibonacci confluence: a base that aligns with a 38.2–61.8% retracement on a larger swing increases the quality of the zone.
Price-volume profile / market profile: use profile tools to see if the base overlaps with a high-volume node — that often strengthens a demand zone.
Backtest your RBR rules. Keep a simple spreadsheet that records: instrument, timeframe, date, entry type (retest/breakout), stop, target, volume behaviour, and result. Over time you'll learn which variants of RBR your edge favours.
Post-trade review: annotate failed RBRs to see why they failed (market context, news, liquidity). Many failed set-ups result from ignoring a larger opposing supply zone or from news-driven volatility.
Identify the initial impulsive rally.
Confirm a distinct base (narrow range / small bodies).
Check higher-timeframe trend for alignment.
Look for volume characteristics (lower in base, higher on re-rally).
Choose entry method: retest (preferred) or breakout.
Place stop where structure is invalidated.
Set realistic targets and manage risk (use defined risk per trade).
Review trade after close; log observations.
RBR is a clear, structural way to interpret where buying interest sits on a chart. It is not a magic bullet: success requires context, discipline, and risk management.
Use RBR alongside volume analysis, higher-timeframe trend assessment, and sensible position sizing. When applied carefully — favouring retests and using logical stops — the RBR can supply repeatable, well-defined trading opportunities.
Disclaimer: This material is for general information purposes only and is not intended as (and should not be considered to be) financial, investment or other advice on which reliance should be placed. No opinion given in the material constitutes a recommendation by EBC or the author that any particular investment, security, transaction or investment strategy is suitable for any specific person.