Published on: 2026-04-10
Updated on: 2026-04-10
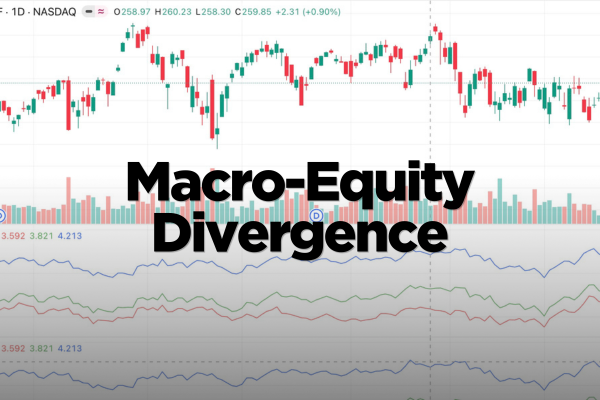
Macro-equity divergence occurs when broad economic indicators such as inflation, growth, and interest rates move in one direction, while equity markets move in another. This disconnect often signals shifting investor expectations rather than current economic reality, making it a critical concept for traders who rely on both macroeconomic data and price action to make informed decisions.
Macro-equity divergence reflects a mismatch between economic fundamentals and stock market performance.
Markets often price in future expectations rather than current conditions.
Central bank policy and liquidity conditions can override weak or strong macro data.
Divergence can signal turning points, volatility, or trend continuation risks.
Traders use divergence to anticipate market re-pricing events.
To understand macro-equity divergence, it is important to separate the two forces that drive financial markets:
Macroeconomic conditions represent the underlying health of an economy. Key indicators include:
Employment data
Consumer spending trends
Equity markets reflect investor expectations about future corporate earnings and economic conditions. Major drivers include:
Risk sentiment
Institutional positioning
Global capital flows
In efficient conditions, both macroeconomic data and equity prices tend to align. However, markets frequently decouple from fundamentals for extended periods.
Macro-equity divergence occurs when economic data suggests one direction for the economy, while stock markets move in the opposite direction.

Equity markets are not reactive; they are predictive. Investors price in expected conditions 6–18 months ahead of actual data.
For example, during early 2026, markets may rally despite weak current manufacturing data if investors anticipate future interest rate cuts from central banks such as the Federal Reserve.
Monetary policy often overrides macroeconomic signals. When liquidity increases, asset prices can rise even in weak economic conditions.
Key influences include:
Interest rate expectations
Quantitative tightening or easing
Real yields and bond market conditions
For instance, technology-heavy indices such as the NASDAQ-100 ETF (QQQ) may rise even when consumer confidence weakens, if markets expect looser financial conditions ahead.
Stock prices depend heavily on corporate earnings expectations rather than current macro data.
If analysts revise earnings upward for major companies such as Apple or Microsoft, equities can rally even if GDP growth slows.
Markets can temporarily detach from fundamentals due to:
Short-term hedging flows
Options market positioning
Risk-on / risk-off sentiment shifts
Geopolitical uncertainty
This is especially visible during global events or sudden liquidity shifts.

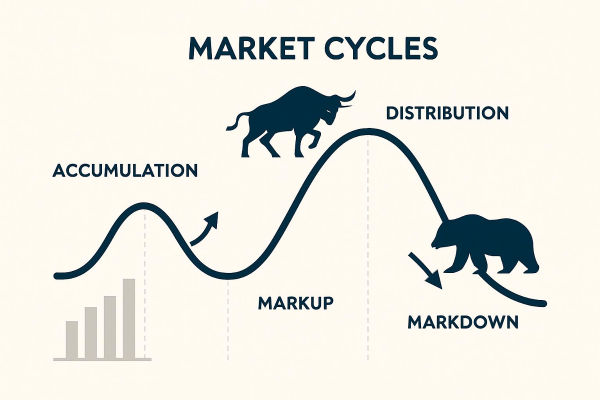
A classic macro-equity divergence pattern often occurs during late-cycle economic conditions:
Inflation remains elevated
Central banks maintain a restrictive policy.
Economic growth slows
Yet equity markets may rally due to expectations that:
Rate cuts are approaching.
Inflation will stabilize
Corporate earnings will recover.
This creates a “disconnect phase” where traders must distinguish between current reality and future pricing.
Understanding divergence helps traders:
Avoid misinterpreting short-term market strength or weakness.
Identify potential turning points in trends.
Improve timing for entries and exits.
Recognise when markets are overpricing optimism or pessimism.
Align strategies with liquidity cycles rather than headline data.
Traders typically approach macro-equity divergence in three ways:
If liquidity remains supportive, divergence may persist longer than expected.
If macro conditions deteriorate sharply while equities remain elevated, a correction may follow.
Traders combine macro data with technical indicators to confirm whether divergence is stabilising or breaking down.
Macro-equity divergence refers to a situation in which economic data, such as growth or inflation, moves in one direction, while stock markets move in the opposite direction. It highlights a disconnect between real-world conditions and investor expectations.
Stock markets are forward-looking and price in future expectations rather than current conditions. Investors react to anticipated central bank policy, earnings forecasts, and liquidity changes, which can cause markets to diverge from present macroeconomic trends.
Not necessarily. Divergence can signal both bullish and bearish outcomes depending on context. Sometimes it reflects optimism about future recovery, while in other cases it may indicate overvaluation and risk of correction.
Interest rates strongly influence liquidity and discount rates. Lower expected rates can push equities higher even during weak economic periods, while higher rates can suppress stocks despite strong macro data.
Traders use divergence to identify potential market turning points, assess risk-reward conditions, and align strategies with macro trends and liquidity cycles rather than relying solely on headline economic data.
Macro-equity divergence is a key concept in modern financial markets, especially in environments shaped by central bank policy, liquidity shifts, and forward-looking investor behaviour. Rather than viewing it as a contradiction, traders should interpret it as a signal that markets are pricing in future conditions that may not yet be visible in economic data.
Disclaimer: This material is for general information purposes only and is not intended as (and should not be considered to be) financial, investment or other advice on which reliance should be placed. No opinion given in the material constitutes a recommendation by EBC or the author that any particular investment, security, transaction or investment strategy is suitable for any specific person.