Netflix (NFLX) has had an exciting year, but the last few months have been much tougher for anyone holding the NFLX stock.
After hitting record highs in mid-2025, Netflix stock is falling into a clear pullback, and the chart looked even more alarming after the recent 10-for-1 stock split, when some apps briefly showed a “90% crash” overnight.
Under the surface, the story is more nuanced. Netflix is still growing, but it has disappointed on earnings quality, guided margins a touch lower, and raised new questions with potential deal activity and fresh legal noise.
At the same time, the stock has broken below key moving averages, which has triggered technical selling.
Right now NFLX trades near $96.10, roughly 28.3% below its 52-week high of $134.12 and down about 9.2% over the past month, even though it is still up around 19.6% over the last year.
This article breaks down what is really driving the latest drop in Netflix, how the stock has traded recently, and which levels traders are watching. It is for information only and is not investment advice.
Why Is Netflix Stock Dropping Right Now?
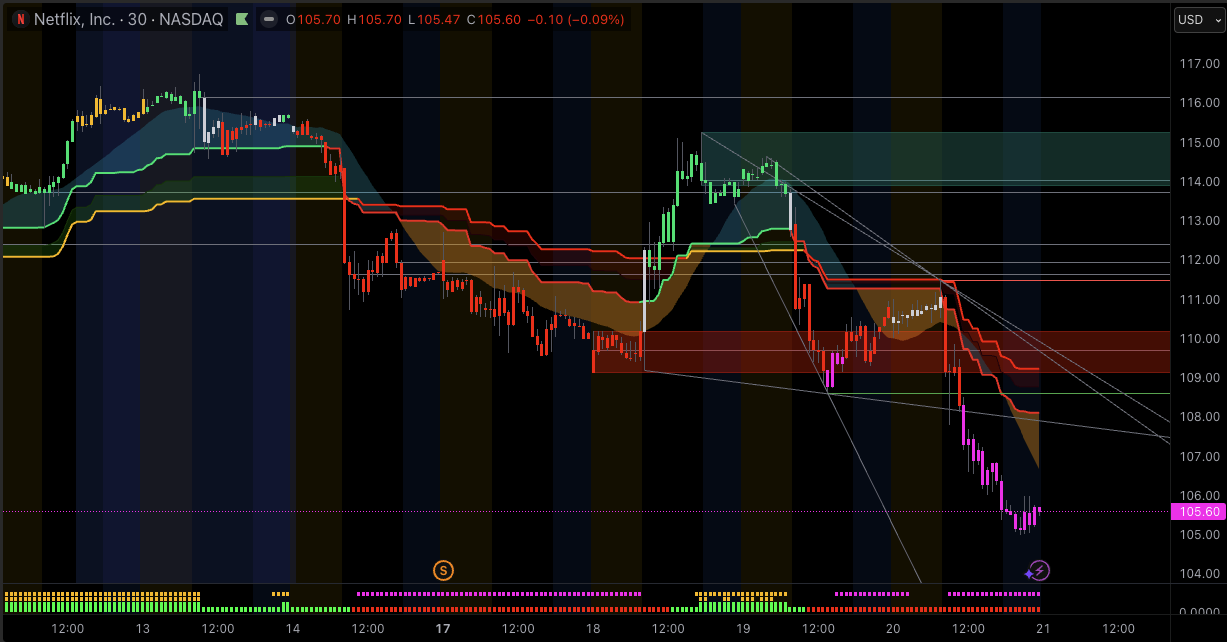
Today, Netflix shares trade around 105-110 dollars after the stock split and are down sharply from their late-June highs (on a split-adjusted basis).
Over the last month, the stock has dropped in double-digit percentage terms as investors reassess earnings quality, deal risk and valuation, while technical indicators flip to “sell.”
The main drivers of Netflix’s recent drop are:
A Q3 earnings miss on earnings per share due to a large Brazilian tax charge and slightly lower margin guidance.
Concerns over a possible bid for Warner Bros. Discovery assets, a new class-action lawsuit and fresh analyst downgrades.
A valuation reset after a big rally, in a sector facing intense streaming competition and broader tech risk-off moves.
A technical breakdown below key moving averages, with MACD negative and multiple indicators flashing “sell” on daily charts.
Optical impact from the 10-for-1 stock split, which made the chart look like a 90% crash even though fundamentals did not change overnight.
Recent Performance of Netflix: 1 Week, 1 Month, 6 Months
Before looking at the reasons, it helps to see how Netflix has actually traded.
As of early December 2025, Netflix is around 95.8 dollars, down just under 8% in the last week and about 13% over the last month, but still up around 5% over the past year even though it is down more than 20% over six months.
Netflix - Last Week
Over the past week, NFLX is down about 8%, underperforming the Nasdaq as investors hit the stock with several fresh worries at once.
News flow has been heavy: reports that Netflix is interested in acquiring Warner Bros. Discovery assets, a newly filed class-action lawsuit, and at least one major Wall Street bank cutting its price target have all weighed on sentiment.
That mix has kept intraday volatility elevated and left short-term traders quick to sell into any bounce.
Netflix - Last 1 Month
Over the last month, Netflix shares have fallen roughly 14%, largely in a straight line lower after the Q3 earnings release.
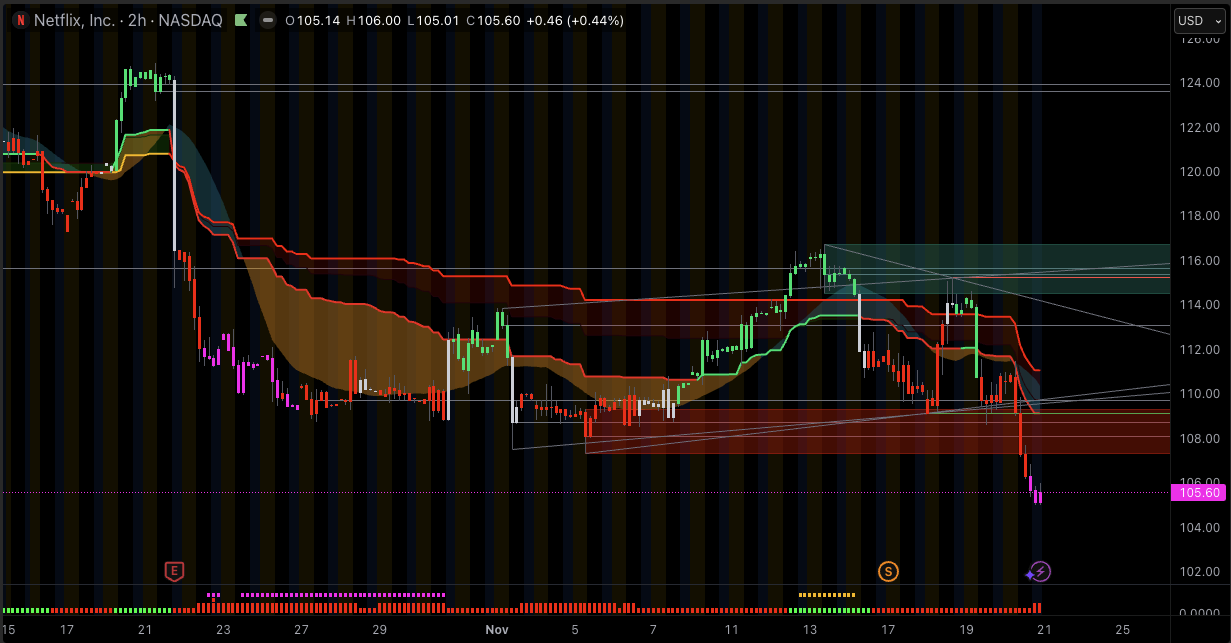
The company reported strong revenue growth of about 17% year-on-year, but earnings per share came in below expectations, mainly because of a one-off 619 million dollar tax expense in Brazil.
Management also trimmed full-year operating margin guidance from about 30% to 29%, even while keeping a bullish revenue outlook.
The combination of a headline miss and lower margin guidance triggered a sharp post-earnings selloff and pushed the stock below its 20-day and 50-day moving averages.
Netflix - Last 6 Months
Zooming out, the picture is more balanced. Over the past six months, Netflix still shows a solid positive total return (around 40–50%, depending on the source), even after the recent drop.
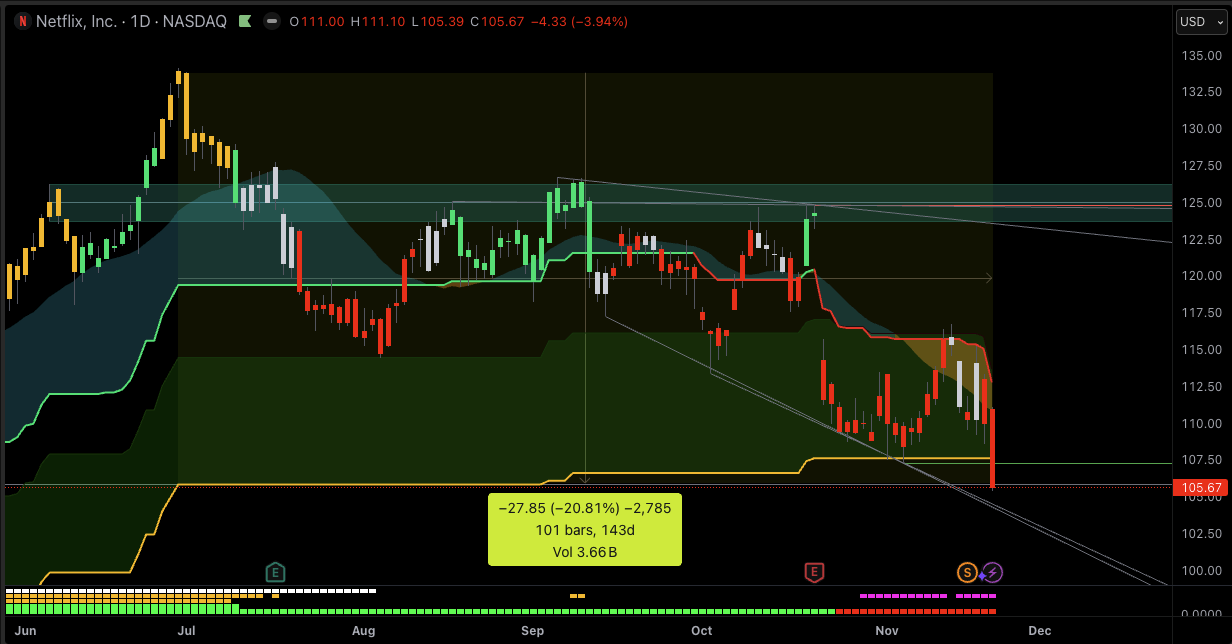
The stock surged into late June on strong subscriber growth, rising ad-tier traction and optimism around sports and live content. It then pulled back from an all-time high (pre-split) as investors questioned how much good news was already priced in.
So the latest fall looks less like a total trend change and more like a correction in a longer-term uptrend that had run very hot.
Main Reasons Behind Netflix’s Drop
1. Earnings Quality, Brazilian Tax Charge & Margin Guidance
Netflix’s Q3 2025 numbers looked strong at first glance: revenue around 11.5 billion dollars, up roughly 17% year-on-year, and healthy growth in ad revenue and engagement.
However, earnings per share came in at 5.87 dollars, well below analyst expectations of just under 7 dollars, mainly because of a 619 million dollar one-off charge linked to a Brazilian tax dispute.
That tax item is genuinely non-recurring, but markets care about the headline miss. When a stock is priced for perfection, traders often react first and ask questions later.
Management also cut its full-year operating margin guidance from about 30% to 29%, citing that tax hit, even while reaffirming its revenue target of 45.1 billion dollars and a solid growth path into 2026.
For many investors, this shift in margin guidance, combined with the one-off expense, was enough to trigger profit-taking after a powerful rally.
2. Deal Risk, WBD Rumors & Legal Noise
A major overhang now is deal risk. Multiple reports say Netflix is exploring a potential bid for parts of Warner Bros.
Discovery’s studio and streaming assets. Markets worry that any large acquisition could be expensive, complex to integrate and heavily scrutinized by regulators in the US and Europe.
Recent sessions have seen single-day drops of 2-4% as investors react to each new headline about a possible bid and the regulatory and strategic implications.
At the same time, the stock is dealing with a new class-action lawsuit related to disclosures and subscriber metrics, which adds another layer of uncertainty, even if these cases often take years to resolve.
Finally, at least one major bank, JPMorgan, has cut its price target on Netflix, citing concerns about subscriber growth, competition and the risk around big strategic moves.
Price-target cuts from large banks tend to feed into short-term selling pressure, especially after a period of strong outperformance.
3. Premium Valuation, Streaming Competition & Macro Pressure
Even after the pullback, Netflix trades on a premium valuation vs. many peers, with forward price-to-earnings estimates above 30-40 times in some models earlier this year. (Nasdaq)
That premium reflects genuine strengths: more than 300 million global subscribers, leading engagement, a growing advertising business and new revenue lines in sports and live events.
But competition from Disney+, Amazon Prime Video and Apple TV+ remains intense. Rivals are also investing heavily in content, sports rights and technology, often with support from larger ecosystems such as e-commerce, hardware or theme parks.
That puts ongoing pressure on content spending and margins, even for a leader like Netflix.
Macro conditions have not helped. In recent sessions, the Nasdaq has dropped more than 2% in a day, with crowded, high-multiple growth names like NFLX often leading the decline when traders move to reduce risk.
4. Technical Breakdown & Stock Split Optics
From a chart perspective, Netflix has broken below key moving averages. On the daily chart (pre-close figures from November 20):
The 20-day simple moving average (SMA) sits around 111.15 dollars.
The 50-day SMA is near 116.57 dollars.
The 200-day SMA is about 113.27 dollars.
With the stock trading around 105-106, price is below all three levels, which most technical systems treat as a short-term downtrend. The MACD reading is -1.28, also pointing to bearish momentum, and the overall technical consensus on some platforms is “Strong Sell.”
On top of that, the 10-for-1 stock split that became effective on 17 November 2025 made the chart look like a 90% collapse, even though total market value did not change. That kind of optical move can unsettle less-experienced investors and briefly distort sentiment.
Technical View: Key Levels Traders Are Watching on Netflix
From a technical analysis perspective, Netflix is in a short-term downtrend on the daily chart, within a still-positive longer-term trend after a very strong run earlier in 2025.
Current Trend and Momentum
Price action now shows a clear series of lower highs and lower lows since the late-June peak. At the same time, momentum indicators are soft but not yet deeply oversold.
Here is a simple technical indicator snapshot (values as of the November 20 New York session):
| Indicator |
Latest Value |
Signal |
Comment for Traders |
| RSI (14) |
42.90 |
Neutral |
Momentum weak, but not yet in classic oversold zone |
| MACD (12,26) |
-1.28 |
Sell |
Confirms downside bias after recent breakdown |
| 5-day SMA |
112.20 |
Sell |
Price below very short-term trend |
| 20-day SMA |
111.15 |
Sell |
Short-term trend now above spot |
| 50-day SMA |
116.57 |
Sell |
Medium-term trend clearly above, downtrend in play |
| 100-day SMA |
119.47 |
Sell |
Confirms longer swing-high zone |
| 200-day SMA |
113.27 |
Sell |
Price below long-term average, but not far under |
| ADX (14) |
16.98 |
Buy (weak trend) |
Trend strength still low, room for either side |
| Williams %R (14) |
-71.66 |
Buy |
Approaching oversold territory |
| CCI (14) |
-22.30 |
Neutral |
Sideways momentum, no extreme |
Overall, this mix tells a simple story: trend and MACD lean bearish, but momentum is not washed-out, so short-term downside could continue if support breaks.
Important Support and Resistance Zones
Using recent highs, lows and Fibonacci levels, many short-term traders are watching the following areas:
What Bulls and Bears Are Looking For
For bulls, key signals would be:
Price holding above about 100–102 dollars and bouncing with stronger buying volume.
A move back above the 20-day and 50-day moving averages, ideally with RSI rising through 50.
For bears, the focus is on:
A clean break below the 100–102 dollar zone, which could open the door to a deeper pullback toward the mid-90s.
Continued lower highs and weak reactions to any positive news on earnings, deals or guidance.
Can I trade Netflix with EBC Financial Group?
Yes. Netflix is available to trade via CFDs with EBC Financial Group, alongside major global stocks, indices, forex and commodities. This lets you take long or short exposure without owning the underlying shares, while using risk-management tools such as stops and limits.
Always remember that leveraged trading can magnify both gains and losses.
How Traders Can Approach Netflix with EBC Financial Group
For active traders, Netflix has become a classic high-beta, high-liquidity name: big daily ranges, heavy news flow and clear technical levels. That creates opportunity, but also real risk.
With EBC Financial Group, traders can access Netflix CFDs alongside other major stocks, indices, forex pairs and commodities, allowing both long and short positioning based on their view of the next move.
With EBC Financial Group, traders can:
Trade Netflix around earnings, news and technical levels without taking direct ownership of the shares
Use advanced charting tools to follow moving averages, RSI, MACD and support/resistance zones in real time
Apply stop-loss and take-profit orders to manage downside risk and protect unrealised gains
Combine Netflix exposure with broader index or FX hedges inside a single, regulated trading environment
Risk warning: Trading leveraged products involves a high level of risk and may not be suitable for all investors. You can lose more than your initial investment. Always consider your objectives and seek independent advice if needed.
Frequently Asked Questions (FAQ)
1. Why is Netflix stock falling today?
Recent weakness reflects a mix of factors: follow-through selling after the Q3 earnings miss and lower margin guidance, worries around a possible Warner Bros. Discovery deal, a new class-action lawsuit, and fresh analyst price-target cuts, all against a risk-off backdrop in tech.
2. Did Q3 earnings cause Netflix to drop?
Yes, Netflix fell after Q3 earnings. While revenue and subscribers were strong, EPS missed forecasts due to a one-time Brazilian tax, and margin guidance was lowered, disappointing investors.
3. Will Netflix recover after this drop?
Recovery is possible, but not guaranteed. A sustained bounce would likely need: continued double-digit revenue growth, clearer visibility on margins after the tax issue, a sensible outcome on any potential deal activity, and a move back above key moving averages on the chart. Traders should treat any scenario with careful risk management.
4. Is Netflix too risky to trade right now?
Netflix is volatile, not untradeable. The stock moves quickly on news and often swings several percent in a day. Position sizing, leverage control, and disciplined stop-loss levels are essential. Short-term traders may see opportunity on both sides.
Final Thoughts: What This Drop in Netflix Really Means
Netflix’s recent slide is not the result of one simple problem. It reflects a combination of an earnings miss driven by a tax dispute, slightly weaker margin guidance, growing deal and legal questions, a premium valuation and a clear technical breakdown after a big rally.
At the same time, the apparent “90% crash” around the stock split is mostly an optical effect, not a collapse in business value. Underlying growth in revenue and engagement remains solid, but expectations and positioning were high, so even a modest disappointment has led to a sharp reset.
For traders, the message is simple: respect the trend and the levels, stay aware of the news around deals and regulation, and use a regulated broker such as EBC Financial Group if you choose to trade Netflix or other large-cap growth names with leverage.
Disclaimer: This material is for general information purposes only and is not intended as (and should not be considered to be) financial, investment or other advice on which reliance should be placed. No opinion given in the material constitutes a recommendation by EBC or the author that any particular investment, security, transaction or investment strategy is suitable for any specific person.
