Published on: 2025-03-27
Updated on: 2026-07-20
The inverse head and shoulders is a bullish reversal chart pattern. It forms at the end of a downtrend and signals that price may be turning up. It is the mirror image of the standard head and shoulders, which is a bearish pattern that forms at the top of an uptrend.
The inverse head and shoulders is a bullish reversal pattern that forms after a downtrend.
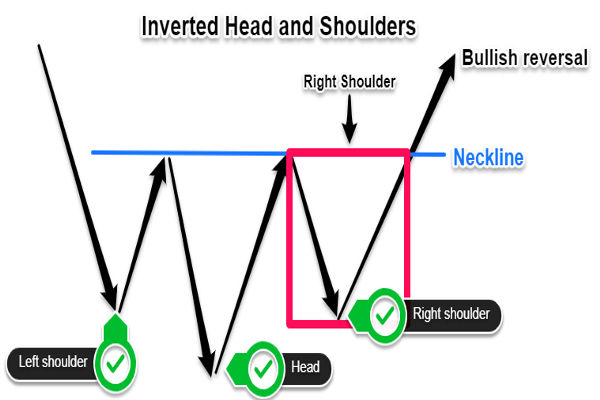
It has three troughs: a left shoulder, a lower head, and a higher right shoulder.
The neckline connects the two highs between the troughs. A close above it confirms the pattern.
Price target = neckline breakout level + (neckline − head low).
The pattern is voided if price drops below the head.
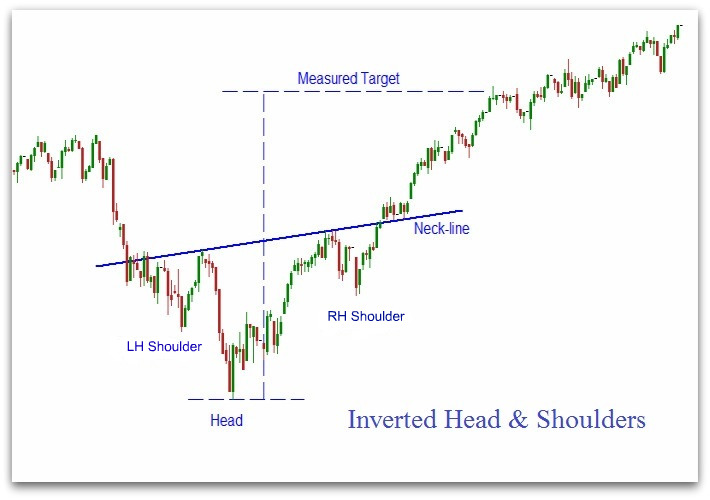
The inverse head and shoulders pattern (also called the inverted head and shoulders, the reverse head and shoulders, or the head and shoulders bottom) is a bullish reversal pattern. It appears after a downtrend and signals a possible shift from a falling market to a rising one.
It is built from three troughs, or low points:
Left shoulder: price falls to a low, then bounces up.
Head: price falls again to a lower low, then bounces up. This is the deepest point.
Right shoulder: price falls a third time but stops at a higher low than the head, then turns up.
A line called the neckline connects the two highs between the troughs. When price closes above the neckline, the pattern is considered complete. The formation was described in detail by Robert Edwards and John Magee in their 1948 book, Technical Analysis of Stock Trends, and it remains one of the most widely taught reversal patterns.
For the wider family of chart formations, see our guide to Chart patterns. For the bearish version, see the standard head-and-shoulders pattern.
The inverse head and shoulders is bullish. It forms at the bottom of a downtrend and signals a possible move higher.
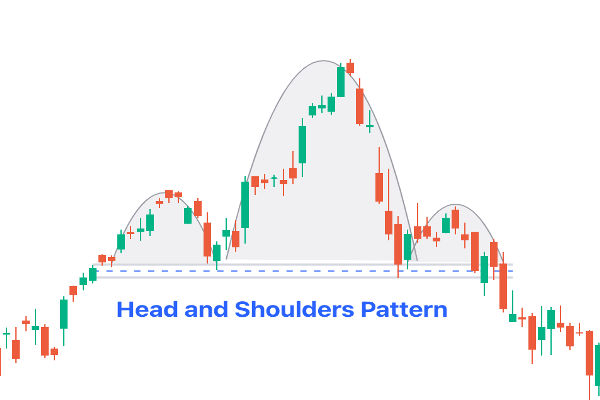
The standard head-and-shoulders pattern is bearish. It forms at the top of an uptrend and points to a possible move down.
A simple way to remember it: the inverse pattern looks like a head and two shoulders turned upside down, and it sits at a market bottom. The higher low on the right shoulder is the first sign that sellers are losing control.
Prior downtrend: there must be a real downtrend before the pattern can be considered a reversal.
Left shoulder: the first trough.
Head: the lowest trough, in the middle.
Right shoulder: a higher low, roughly level with the left shoulder.
Neckline: the line across the two reaction highs. It can be flat or sloped.
Shoulders do not need to be equal. The key rule is that the head is the lowest point and the right shoulder is a higher low. If price later drops below the head, the pattern is void.
Draw the neckline by connecting the two highs that form between the troughs: the high after the left shoulder and the high after the head. Extend this line to the right.
The neckline can be flat, slope up, or slope down. Most charting sources treat a flat or upward-sloping neckline as the cleaner reading and a downward-sloping one as requiring more care. A sloping neckline is handled the same way: the breakout is the close beyond the neckline, and the target is measured straight up from the head to the neckline.
The price target uses a measured move. The method is:
Measure the vertical distance from the head (the lowest point) up to the neckline.
Add that same distance to the point where price breaks above the neckline.
The formula:
Price target = neckline breakout level + (neckline − head low)
Worked example. Say the head bottoms at 45.00 and the neckline sits at 52.00. The height is 52.00 − 45.00 = 7.00. If price breaks the neckline at 52.00, the measured target is 52.00 + 7.00 = 59.00.
Sloping neckline example. If the neckline is not flat, measure the height straight from the head up to the neckline, then project the same distance from the actual breakout point. If the head is at 45.00, the neckline sits at 53.00 at the point of the break, and the height measured up from the head is 7.00, the target is 53.00 + 7.00 = 60.00.
A measured target is a rough guide, not a promise. Price can fall short or run further. Many traders also look at earlier resistance levels for added context. To read price moves in more detail, see our explainer on support and resistance.
There are two common entry methods:
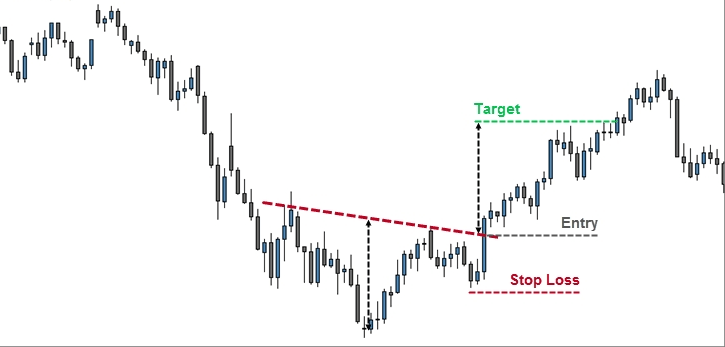
Breakout entry: enter when price closes above the neckline, ideally with rising volume. This catches the move early but can be caught by a false break.
Retest entry: wait for price to break the neckline, then pull back to it. If the old neckline holds as new support, enter on the bounce. This gives a clearer risk level, but the pullback does not always happen.
Waiting for a close beyond the neckline, rather than a brief intraday poke, is the more conservative reading. Edwards and Magee suggested that a penetration of around 3 per cent of price is a meaningful break, which helps filter out small false moves.
The most common stop is just below the right shoulder low. A break back below that level suggests the reversal has failed. More cautious traders place the stop below the head, which is wider but harder to trigger by normal swings. A move below the head voids the pattern.
Matching position size to the distance between entry and stop is part of managing trading risk.
Volume helps confirm the pattern. In the classic reading, volume tends to fade as the head and right shoulder form, then expand sharply on the break above the neckline. A breakout on strong volume shows buyers are committed. A breakout on weak volume is more likely to fail.
Charting sources note that volume confirmation matters more for the bottom (inverse) pattern than for the top pattern. Without a clear volume pickup on the break, the signal is weaker. For the tools traders use to read this, see our guide to volume indicators.
Both patterns share the same building blocks and the same measured-move method, but they point in opposite directions.
Feature |
Inverse head and shoulders |
Standard head and shoulders |
Shape |
Three troughs |
Three peaks |
Forms after |
A downtrend |
An uptrend |
Signal |
Bullish (up) |
Bearish (down) |
Confirmed by |
Close above the neckline |
Close below the neckline |
Target projected |
Upward from the breakout |
Downward from the breakdown |
No chart pattern works every time. Common failure signs:
The breakout happens on weak volume and fades.
Price closes back below the neckline after the break and loses the right shoulder low.
A price drop below the head voids the pattern.
Patterns can also be subjective. Two traders may draw necklines differently. This is why confirmation, a clear stop, and sensible position size matter. This article explains how the pattern works. It does not tell anyone what to buy or sell.
The pattern has been studied by researchers at a central bank. Carol Osler and P.H. Kevin Chang, in “Head and Shoulders: Not Just a Flaky Pattern” (Federal Reserve Bank of New York Staff Report No. 4, 1995, later published in The Economic Journal in 1999), tested a mechanical head and shoulders trading rule on daily exchange rates for six major currencies from 1973 to 1994. They found the rule was profitable for two of the six currencies, but not for the other four, and that it was matched or beaten by simpler trading rules.
Reference works on chart patterns reach a similar balanced view. Thomas Bulkowski’s Encyclopedia of Chart Patterns ranks the head and shoulders bottom among the more dependable bullish reversal patterns, with a low failure rate and its measured target reached in most, though not all, cases. The CFA Institute curriculum also lists the inverse head and shoulders as a standard reversal pattern with the same target formula.
The takeaway is consistent. The pattern can carry useful information, but it is not a guarantee, and it works best as one tool among several.
Bullish. It forms after a downtrend and signals a possible move higher.
A bullish reversal pattern made of three troughs: a left shoulder, a lower head, and a higher right shoulder, with a neckline across the two highs between them.
The inverse forms at a bottom and is bullish. The standard forms at a top and is bearish.
No. It can slope up or down. Measure the target from the head, straight up to the neckline, and project it from the breakout point.
The inverse head and shoulders is one of the clearest ways a chart shows a downtrend losing strength. The structure is simple to check: a low, a lower low, then a higher low, with a neckline on top. The measured move gives a first target, and the head gives a clear level that voids the pattern if broken.
One practical point that many guides skip: the quality of the breakout matters more than the shape. A clean pattern that breaks on weak volume and then falls back below the neckline is the most common trap. Reading the break, not just the drawing, is what separates a useful signal from a false one.
Disclaimer: This material is for general information purposes only and is not intended as (and should not be considered to be) financial, investment or other advice on which reliance should be placed. No opinion given in the material constitutes a recommendation by EBC or the author that any particular investment, security, transaction or investment strategy is suitable for any specific person.