Published on: 2025-06-24
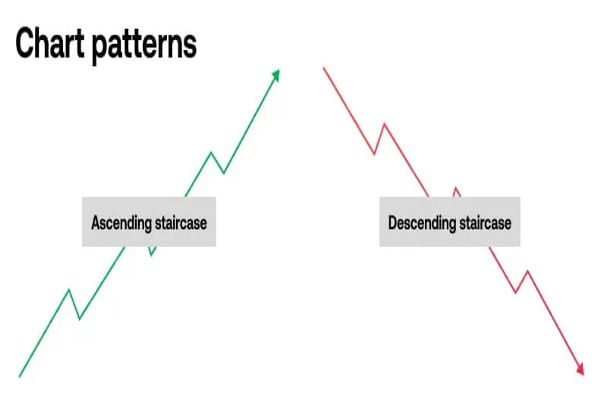
The world of technical analysis is filled with Chart Patterns that offer clues about future price movements. Among these, the head and shoulders pattern stands out as a key signal for spotting potential reversals. Recognised for its clarity and reliability, it has become a staple in the toolkit of both novice and experienced traders.
Understanding how the head and shoulders pattern works can give you a significant edge, especially when the market seems uncertain. It's not just about recognising shapes on a chart — it's about understanding what those shapes reveal about market sentiment.

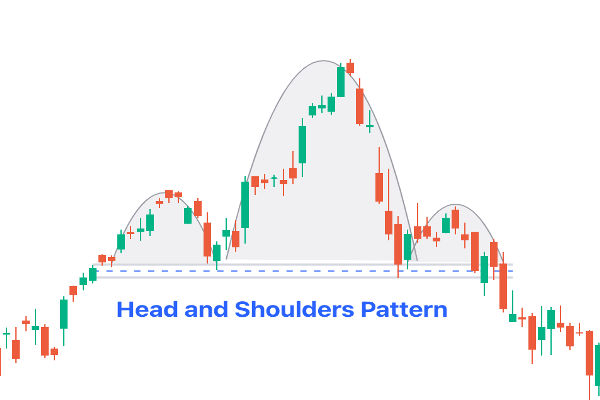
At its core, the head and shoulders pattern signals a potential shift in market direction, usually from bullish to bearish. The pattern forms after an upward trend and consists of three peaks: the left shoulder, the head, and the right shoulder. The middle peak is the highest, while the two outside peaks are slightly lower and roughly equal in height. A support line, known as the neckline, is drawn by connecting the troughs between the shoulders and the head.
When the price breaks below the neckline, the pattern is considered complete. This breakdown is interpreted by many traders as a sign that the previous uptrend has likely ended, and a downward move may follow.
What makes the head and shoulders pattern so useful is its ability to visualise a weakening trend. Initially, buyers push the price higher, creating the left shoulder. Confidence builds further, leading to a new high that forms the head. However, when the price fails to reach a new high during the formation of the right shoulder, this often signals that the bullish momentum is fading.
This change in momentum can reflect uncertainty among traders, reduced buying pressure, or growing selling interest. When the price then breaks through the neckline, the shift in sentiment becomes more apparent, and many view it as confirmation of a new downward trend.

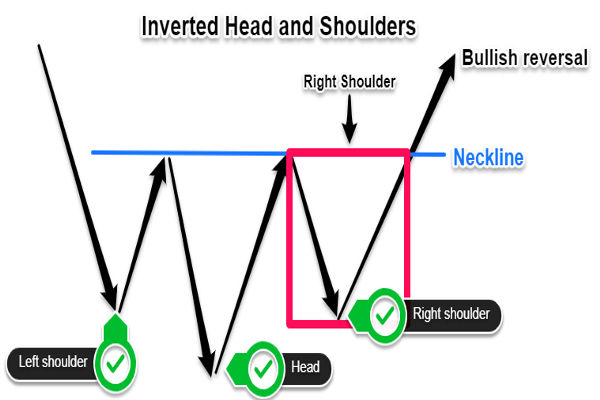
While the classic head and shoulders pattern points to a possible market top, its inverse version indicates a potential bottom. The inverse head and shoulders pattern appears after a downtrend, forming three troughs — the central one being the lowest. This version suggests the end of bearish pressure and the start of a potential reversal to the upside.
The principle is the same: a neckline connects the two highs between the troughs. When the price breaks above that neckline, many traders interpret this as a strong buying signal. Both versions of the pattern help traders decide when to close existing positions or open new ones aligned with the emerging trend.

In live markets, patterns rarely form with perfect symmetry. However, the head and shoulders pattern is generally easy to recognise if you focus on the structure. First, you should see a clear uptrend leading into the formation. The three peaks must stand out — with the central peak visibly higher than the others. Then draw the neckline through the two low points that sit between the peaks.
Traders often wait for a decisive close below the neckline before acting, as early entries carry greater risk. Confirmation might also come from a rise in trading volume during the breakout, which suggests stronger conviction behind the move.
Despite the rapid evolution of trading tools and platforms, the head and shoulders pattern continues to hold its place in modern analysis. Part of its appeal lies in its psychological depth. The pattern does more than trace price — it maps shifts in market belief. When buyers become less aggressive and sellers begin to take control, the pattern offers a way to visualise that turning point.
Its usefulness spans different asset classes, including forex, equities and commodities. Traders who operate on different timeframes, from short-term intraday setups to longer swing trades, find it applicable and actionable.
Even reliable patterns can lead to errors when misused. One of the most frequent mistakes is entering a trade before the neckline breaks. Patterns that look promising can fail to complete, especially in choppy or low-volume markets. Without a confirmed breakout, the head and shoulders pattern remains incomplete and offers no clear signal.
Another issue arises from forcing the pattern to fit. Not every trio of peaks forms a true head and shoulders structure. Traders should always combine pattern recognition with broader analysis, including trend strength, support and resistance, and volume behaviour.
Overreliance on any single signal can also reduce effectiveness. The head and shoulders pattern should be one part of a well-rounded approach that includes risk management and confirmation from other indicators.
Once confirmed, the head and shoulders pattern provides useful guidance for trade entries, exits and risk control. Many traders calculate a price target by measuring the distance between the head and the neckline, then projecting that distance downwards from the breakout point. This gives an approximate range in which the price might move.
Stop-loss levels are often placed just above the right shoulder in a classic pattern, or just below it in an inverse setup. This protects the position if the breakout fails and the price reverses. By combining the pattern with clear rules and discipline, traders can make more structured decisions even in volatile conditions.

When compared to double tops or triple tops, the head and shoulders pattern offers a more layered perspective. The additional peak or trough gives traders more information about the weakening trend. It is also easier to confirm, particularly when supported by volume shifts and broader market signals.
While some traders prefer trendline-based strategies or rely heavily on indicators, the head and shoulders pattern stands out for its ability to deliver visual cues with relatively few false signals — when properly used.
The head and shoulders pattern remains a trusted indicator among traders looking to anticipate trend changes. Its simplicity is backed by deep market logic, and its flexibility makes it relevant across instruments and timeframes.
By recognising the structure, waiting for confirmation and applying it with a disciplined strategy, traders can use this pattern to enhance decision-making and manage risk more effectively.
Disclaimer: This material is for general information purposes only and is not intended as (and should not be considered to be) financial, investment or other advice on which reliance should be placed. No opinion given in the material constitutes a recommendation by EBC or the author that any particular investment, security, transaction or investment strategy is suitable for any specific person.