Published on: 2025-07-15
Updated on: 2026-07-15
Chart patterns are shapes that price forms on a chart, which traders read to judge what price may do next. They recur across markets and timeframes because they reflect the same underlying dynamic: the shifting balance between buyers and sellers. A pattern does not predict the future. It shows where a move is likely to continue, where it may turn, and, just as usefully, the exact point at which the idea has failed.
This guide covers the patterns worth knowing, how to tell a real signal from noise, and how to confirm a pattern before acting on it. It also looks at what published research actually says about whether these shapes work, because much of what circulates online overstates the case.
A chart pattern is a repeated price shape. Traders group patterns into three families: reversal, continuation, and bilateral (can break either way).
A pattern is not confirmed until price closes beyond its key level, usually on rising volume. Acting before that is the most common mistake.
Every pattern has an invalidation level: the price that proves it wrong. That level defines the stop, not a guess.
Measured targets (the projected size of the move) are estimates and minimums, not promises.
Higher timeframes, volume confirmation, and alignment with the wider trend all improve a pattern's dependability. No pattern is guaranteed.
A chart pattern is a recognisable formation made by price over time. Each one maps a small story about supply and demand. A range that keeps failing at the same high tells you sellers defend that level. A series of higher lows into a flat ceiling tells you buyers are getting more aggressive.
Patterns matter for one practical reason. They provide a structure with three fixed points: an entry trigger, a target, and a level indicating that the idea is wrong. That structure is what turns a shape into a plan.
Chart patterns sit within the broader field of technical analysis, which studies price and volume to assess probability rather than value. They work alongside indicators, trendlines, and support and resistance, not in place of them.
These two terms often get mixed up, so it helps to separate them early.
A chart pattern forms over many bars or candles. Think of the full head-and-shoulders shape, which can take weeks to build. A candlestick pattern forms in one to three candles and reads short-term momentum, like a doji or an engulfing candle.
Both are useful. They answer different questions. Chart patterns frame the larger structure. Candlesticks help time the entry inside it. For the shorter formations, see the guide to candlestick patterns.
Every pattern falls into one of three groups. Learning the group first makes the individual shapes far easier to read.
Reversal patterns form at the end of a trend and warn that direction may change. Examples: head and shoulders, double and triple tops and bottoms, rounding bottom.
Continuation patterns form during a trend and suggest a pause before it resumes. Examples: flags, pennants, and most rectangles.
Bilateral patterns can break in either direction, so the trader waits for the break rather than guessing. The clearest example is the symmetrical triangle.
One point causes most confusion. The same shape can be a reversal in one place and a continuation in another. A rectangle inside a strong uptrend usually continues that trend. The same rectangle at the very top of an extended run can mark a reversal. Where the pattern sits in the trend changes what it means. Always read the pattern in the context of the move that came before it.
Use this as a quick reference. The direction shown is the expected move after a confirmed breakout. The measured target is the standard way traders estimate the size of that move.
| Pattern | Family | Typical breakout direction | Confirmation | Measured target |
|---|---|---|---|---|
| Head and shoulders | Reversal | Bearish | Close below the neckline | Height from the head to neckline, projected downward |
| Inverse head and shoulders | Reversal | Bullish | Close above the neckline | Height from the head to neckline, projected upward |
| Double top (M shape) | Reversal | Bearish | Close below the neckline | Pattern height, projected downward |
| Double bottom (W shape) | Reversal | Bullish | Close above the neckline | Pattern height, projected upward |
| Triple top | Reversal | Bearish | Close below support | Pattern height, projected downward |
| Triple bottom | Reversal | Bullish | Close above resistance | Pattern height, projected upward |
| Rounding bottom | Reversal | Bullish | Close above the resistance level (rim) | Depth of the base, projected upward |
| Bull flag | Continuation | Bullish | Close above the upper flag boundary | Flagpole height, projected from the breakout point |
| Bear flag | Continuation | Bearish | Close below the lower flag boundary | Flagpole height, projected from the breakout point |
| Pennant | Continuation | Same as the prior trend | Close beyond the pennant boundary | Flagpole height, projected from the breakout point |
| Rectangle | Continuation (usually) | Same as the prior trend | Close beyond the range boundary | Range height, projected from the breakout point |
| Ascending triangle | Continuation (bullish bias) | Usually bullish | Close above horizontal resistance | Triangle height, projected upward from the breakout point |
| Descending triangle | Continuation (bearish bias) | Usually bearish | Close below horizontal support | Triangle height, projected downward from the breakout point |
| Symmetrical triangle | Bilateral | Either direction | Close beyond either trendline | Triangle height, projected from the breakout point |
| Rising wedge | Reversal or continuation | Usually bearish | Close below the lower trendline | No universally accepted measured target |
| Falling wedge | Reversal or continuation | Usually bullish | Close above the upper trendline | No universally accepted measured target |
| Cup and handle | Continuation | Bullish | Close above the handle resistance | Cup depth, projected upward from the breakout point |
A caution on this table. The direction is a bias, not a certainty. Ascending triangles usually break up and descending triangles usually break down, but both can break the other way. That is why confirmation, covered below, is the step that protects you.
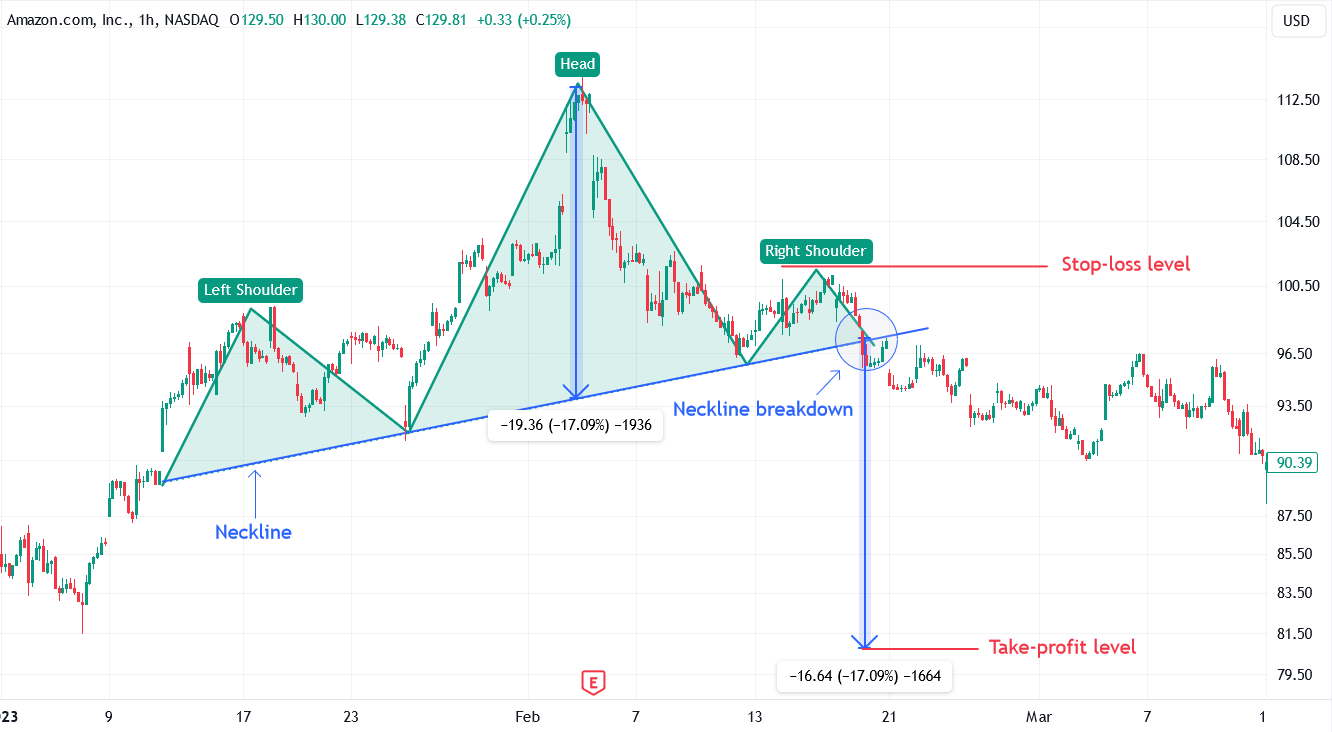
The head and shoulders is a reversal pattern that forms at the top of an uptrend. It has three peaks: a left shoulder, a higher head, and a lower right shoulder. A line drawn across the two lows between the peaks is the neckline.
The pattern completes only when price closes below the neckline. A rise in volume on that break adds weight to the signal. The measured target is the vertical distance from the head down to the neckline, projected downward from the break. Price often returns to test the broken neckline from below before falling further, potentially offering a second entry.
The mirror image is the inverse head and shoulders, which forms at the bottom of a downtrend and points to a move up. For a bottom, a clear volume expansion on the breakout is important, more so than for a top. This pattern has its own detailed head-and-shoulders walkthrough.
A double top looks like the letter M. Price hits a high, pulls back, then fails to break past that same high a second time. The low between the two peaks is the neckline. A close below it points to a move down. A double bottom is the W-shape: two failed attempts to break lower, then a close above the middle high that points upward.
The measured target is the height of the pattern, projected from the neckline break. The stop sits just beyond the second peak or trough, which is the level that would prove the reversal wrong. Do not act on the second peak or trough itself. Many patterns that look like doubles never confirm. The double bottom pattern guide covers the entry and stop in more detail.
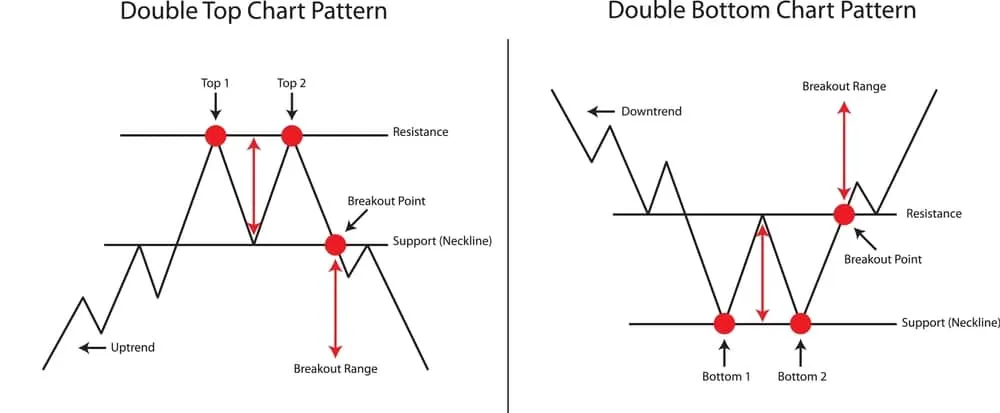
These behave like the double versions but with three tests of the same level instead of two. They are less common. Three failures at a level often show a stronger barrier, so the eventual break can be decisive. As with all reversals, wait for the close beyond support or resistance before treating the pattern as complete.
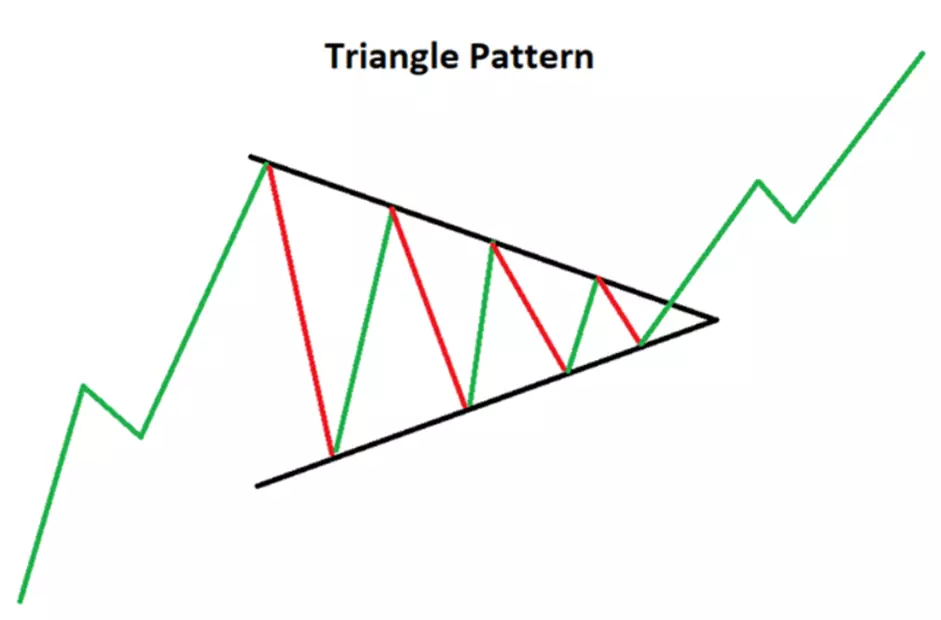
Triangles form as a range narrows and the market coils before a break.
An ascending triangle has a flat resistance line at the top and rising lows beneath it. Buyers keep stepping in higher while sellers defend one price. It carries a bullish bias.
A descending triangle has flat support below and falling highs above. It carries a bearish bias.
A symmetrical triangle has both lines converging, with lower highs and higher lows. This is the bilateral case. It shows indecision, so the trader waits for the break rather than picking a side.
In all three, volume tends to shrink as the triangle forms and expand on the breakout. The target is the triangle's widest height, measured from the breakpoint. The triangle patterns guide covers each type with examples.
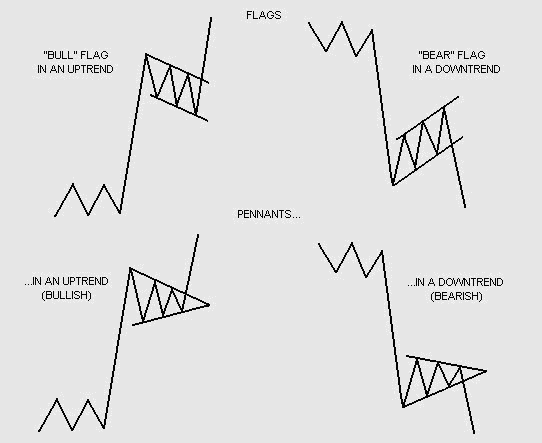
Flags and pennants are short continuation patterns. They appear after a sharp, near-vertical move called the flagpole.
A flag is a small channel that slopes against the trend. A pennant is a small symmetrical triangle. Both mark a brief pause while the market catches its breath, then the original trend usually resumes. Volume is heavy on the flagpole, quiet during the pause, and heavy again on the breakout.
The target is the height of the flagpole, projected from the breakout. Because the pause tends to appear around the middle of the larger move, these patterns often act as a mid-trend marker.
A rectangle is a trading range: price bounces between a flat support and a flat resistance, touching each at least twice. It is neutral while it forms. Most rectangles continue the trend that led into them, though one at the end of a long trend can mark a reversal. Confirmation is a close beyond either boundary, ideally on rising volume. The target is the height of the range, projected from the break. See the rectangle breakout guide for the entry rules.
A rising wedge has two upward-sloping lines that converge, and it usually breaks down, so it carries a bearish bias. A falling wedge has two downward-sloping lines that converge, and it usually breaks up, so it carries a bullish bias. Either can act as a reversal or a continuation, depending on the preceding trend.
Wedges come with an honest limitation. There is no clean formula to measure the size of the move after the break. Traders use prior support and resistance levels, or other tools, to set a target instead of a fixed projection.
The cup and handle is a bullish continuation pattern described by William O’Neil in his 1988 book How to Make Money in Stocks. Price forms a rounded, U-shaped base (the cup), then a small pullback that drifts down or sideways (the handle), then breaks out above the handle high.
O’Neil set out rough proportions still used today: the cup should be a gentle U rather than a sharp V, and the handle should be set in the upper half of the cup and remain shallow. Volume dries up in the handle and expands on the breakout. The target is the depth of the cup, projected up from the break, with the stop below the handle low. The inverted version points downward and is covered in the inverted cup-and-handle guide.
A rounding bottom, or saucer, is a slow, U-shaped base that can take months to form. It shows up best on weekly charts. Volume is high as the earlier decline ends, then fades to a low at the base before rising as price climbs out. Confirmation comes on a close above the resistance rim. Because the full depth of the base is often too far to reach, many traders use a half-depth target as a more realistic first objective.
Spotting a shape is the easy part. Confirmation is what separates a plan from a hunch. Four checks do most of the work.
Wait for the close beyond the level. A pattern is not complete when price merely touches or briefly pokes past the neckline or trendline. It is complete when a candle closes beyond that level. An intrabar spike that snaps back is not a break.
Look for a rise in volume. A break that carries above-average volume is more credible than one on thin trading. As a rule of thumb, traders look for volume well above the recent average, often 1.5 to 2 times the 20-day average, though this is a guide rather than a fixed rule.
Consider the retest. Price often returns to the broken level and tests it from the other side before moving on. A level that held as resistance can act as support after an upward break. A hold on the retest is a second chance to enter with a clear invalidation point.
Check more than one timeframe. A pattern on the daily chart that agrees with the direction of the weekly chart is more dependable than one that fights it. Alignment across timeframes filters out much of the noise.
Every pattern has a level that proves it wrong. For a double bottom, that is a close back below the second trough. For a cup and handle, it is a close below the handle low. Knowing that level before you enter is what lets you set a stop with a reason behind it, rather than a round number.
Two things follow from this.
First, false breakouts are normal. Price breaks a level, pulls traders in, then reverses. This is why the close-beyond rule and the volume check matter. They reduce, though never remove, the number of fakeouts you act on.
Second, a failed pattern can become a signal in its own right. When a breakout reverses hard and price moves back through the pattern, that failure often runs in the opposite direction, because the traders who entered on the break are now trapped and must exit. A pattern that does not do what it should is information, not just a loss.
This is where much online content overstates the case. The honest answer has three parts: patterns carry some real information, no pattern is close to guaranteed, and most published “success rates” are misleading.
Start with the research. In Foundations of Technical Analysis, published in the Journal of Finance in 2000, Andrew Lo, Harry Mamaysky, and Jiang Wang tested common patterns on US stocks from 1962 to 1996 using an automated method. They found that several technical indicators do carry incremental information and may have some practical value. The same authors were candid about the core weakness: the shapes in a chart are often, in their words, in the eyes of the beholder. You can read the working-paper version from the NBER.
Currency markets show a similar mixed result. Carol Osler and Kevin Chang studied the head-and-shoulders pattern in exchange rates for the Federal Reserve Bank of New York in 1995. The pattern had forecasting power for some currencies, such as the German mark and the Japanese yen, but not for others. Their conclusion was measured: the rule was profitable but inefficient, as simpler trading rules performed better.
Now the statistics you see quoted everywhere. Figures like “the head and shoulders works 89 per cent of the time” almost always trace back to one source: the practitioner Thomas Bulkowski and his Encyclopedia of Chart Patterns. Two facts change how you should read them.
The headline number is usually 100% minus the break-even failure rate. Bulkowski defines a break-even failure as a pattern that fails to move even 5 per cent in the breakout direction. So “89 per cent success” really means 11 per cent of patterns did not manage a 5 per cent move. It is not a win rate for a real trade.
The performance figures assume perfect trades. They measure the move from the breakout to the best possible exit, with flawless timing on entry and exit. Real results fall short of that. Bulkowski’s own later work found that patterns failed more often over time, with failure rates roughly doubling between the 1990s and the mid-2000s as more traders acted on the same shapes.
The takeaway is practical. Treat any single “success rate” number with suspicion, especially one without a source or a note on how it was measured. Most circulating figures come from US stock data, not forex, and strip out these caveats entirely.
Acting before confirmation. Entering on the second peak of a double top, or inside a triangle, instead of waiting for the close beyond the level. This is the single most frequent error.
Ignoring the wider trend. A bearish pattern inside a strong uptrend is fragile. Read the pattern against the trend it sits in, not on its own.
Forcing patterns that are not there. On low timeframes especially, noise looks like structure. If you have to squint to see it, it is probably not a pattern.
Skipping the volume check. A breakout with no rise in volume fails more often than one that carries participation.
Trading without an invalidation level. If you cannot say where the pattern is wrong, you cannot size the trade or set a stop.
Treating the target as a promise. The measured move is a first estimate. Price may stop short of it or run well past it.
Over-trading the smallest timeframes. One-minute and five-minute charts are dominated by false breakouts. Daily and weekly patterns hold up better.
Ignoring the economic calendar. A pattern forming into a major data release, such as an inflation print or a central bank decision, can break on the news rather than the shape.
Confirmation bias. Seeing only the patterns that fit what you already want to do.
Missing the retest. Getting stopped out on a fakeout, then failing to re-enter when the broken level holds on the retest.
Textbook charts are clean. Live charts are not. Real patterns are often lopsided, incomplete, or interrupted by a news spike. A right shoulder rarely matches the left one exactly. A neckline is rarely perfectly flat.
The way to handle this is to hold the structure loosely and the rules tightly. Allow the shape to be imperfect. Do not compromise on the two hard rules: wait for the confirmed close, and know your invalidation level before you enter.
Context comes first, shape second. Ask where price sits in the larger trend, whether volume supports the move, and what the higher timeframe is doing. A pattern that aligns with all three is worth more than a textbook shape that runs counter to the trend. Many traders build a plan around the pattern first, then use candlestick signals to fine-tune the entry, and confirm the setup on a trading platform with clean charting tools before acting.
Before acting on any chart pattern, work through these steps in order.
Identify the trend. Is the market rising, falling, or ranging? This tells you whether the pattern is likely a continuation or a reversal.
Map the structure. Draw the neckline, trendline, or range boundary. Count the touches. A pattern needs clean, repeated tests of its levels.
Wait for confirmation. Do not act until the price closes beyond the level, ideally with rising volume.
Set the invalidation level. Decide the exact price that proves the pattern wrong. This is your stop.
Measure the target. Use the standard projection for that pattern as a first estimate, not a fixed destination.
Size the position to the risk. Base the size on the distance to your stop and the risk you have set per trade, using sound risk management principles.
Review after the trade. Whether it worked or not, note what the pattern did. This is how pattern reading improves.
Chart patterns are repeated shapes that price forms on a chart, such as the head and shoulders or the double bottom. Traders use them to judge whether a trend is likely to continue or reverse, and to set an entry, a target, and a level where the idea is wrong.
A continuation pattern forms during a trend and suggests it will resume after a pause, such as a flag. A reversal pattern forms at the end of a trend and warns that the trend may change direction; for example, a head-and-shoulders pattern. The same shape can act as either, depending on where it sits in the trend.
A chart pattern forms over many candles and maps the larger structure. A candlestick pattern forms in one to three candles and reads short-term momentum. Traders often use chart patterns for the plan and candlesticks for the timing.
Higher timeframes, such as the daily and weekly charts, tend to produce more dependable patterns because they filter out short-term noise. Lower timeframes generate more patterns but also far more false breakouts.
Chart patterns endure because they map something that does not change: how buyers and sellers behave at levels that matter to them. That is their strength and their limit. They describe probability, not certainty. The traders who get the most from them are the ones who wait for the confirmed close, always know where the pattern would be wrong, and treat the measured target as a starting estimate. Learn the shapes, then spend most of your effort on the two rules that protect you: confirmation and invalidation. Everything else is detail.