Infosys often moves in step with Nifty IT because sector flows, earnings guidance, and currency trends influence the whole basket, so use rolling correlation and beta to judge alignment, then time entries with sector breadth and event risk for cleaner execution.
Recent buyback headlines and analyst updates have added energy to the tape, which makes confirmation from index direction and breadth especially important before sizing up.
Latest Update & Price

Infosys said its board will consider a share buyback on 11 September 2025, and the share price jumped intraday on the headlines, lifting the Nifty IT tape during the session. Reports noted this would be the first such proposal in nearly three years, adding a short‑term demand impulse as breadth improved across the sector. [1]
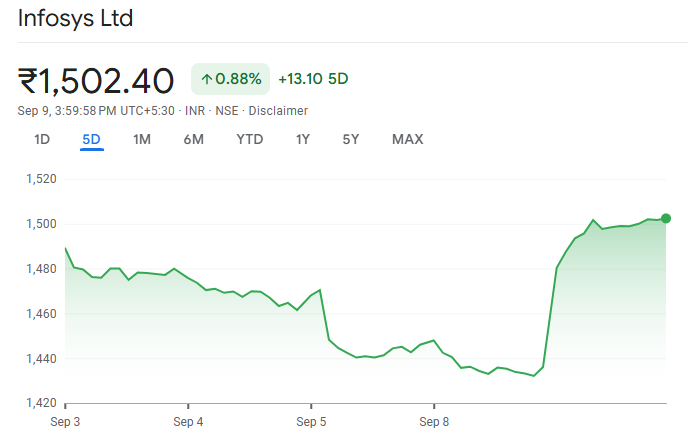
One desk update highlighted cash strength and reiterated a constructive stance, which can steady dips on choppy days for the index. Infosys share price checks showed a move towards ₹1,499.5 intraday on 9 September 2025, while a prior update recorded a close near ₹1,436 on the NSE, so always confirm the latest print on the exchange quote page before placing orders.
Correlation, Beta & Timeframes
Correlation shows how two return series move together from −1 to +1, while beta estimates how much the stock tends to move when the index moves by one unit, so correlation frames co‑movement and beta frames sensitivity for sizing and control.
R‑squared helps judge how much of the stock's variation is explained by the index, which matters when stock‑specific news outweighs sector currents around results or guidance days. Use a short rolling window, such as 30 days, to gauge the current regime and a longer window, such as 90 days, to smooth noise; when both rise together, alignment improves, and when they diverge, reduce the size and ask for extra confirmation before adding risk.
Intraday to five days, headlines and order flow can dominate Infosys, so correlation is less reliable and stops must allow for gaps and slippage around prints and auctions. Over one to four weeks, earnings tone, sector flows, and currency often drive the group, making correlation and beta more useful for timing and position scaling across setups.
At one to six months, macro drift and index flows shape the bigger picture, which guides patience, scaling rules, and expectations for volatility in sector‑aligned trades.
Drivers & Divergence
Sector earnings and guidance set the tone for flows into Indian IT, and large constituents often move together with the index for several weeks when commentary is consistent across the basket. USDINR and global tech demand cues influence valuation and risk appetite, affecting index‑level moves that filter into single names during risk‑on or risk‑off phases.
Corporate actions such as buybacks can add a near‑term demand impulse that tightens the stock‑index link, so confirm action with sector breadth and volume before sizing up. [2]
Company‑specific guidance surprises can override the sector for days, weakening co‑movement and shifting setups to stock signals rather than index cues.
One‑off provisions, client‑mix shifts, or wage‑cost resets can alter the margin path and create divergence even if the index is firm, so treat correlation as conditional rather than permanent.
Index rebalancing and passive flow can distort prints for a few sessions, so confirm alignment with breadth and volume before leaning on correlation for entry and size. Where to check and refresh: pull the live quote and day range from the exchange feed, and cross‑check a mainstream tracker before placing orders, especially around events and auction prints to avoid stale prices.
Setups And Triggers
Sector breadth matters when timing entries; favour longs when Infosys clears a recent swing high while Nifty IT breadth is positive and volume improves, and step down risk if breadth flips or the close slips back under the level.
Pullback To Support: Buy a pullback to a rising average or prior breakout if index momentum holds and breadth stays positive, and treat a second close below the level as a failed retest.
Breakout And Retest: Let price break with firm volume, then buy the first clean retest that holds while the sector remains constructive to reduce false starts.
Divergence Caution: If the stock rises while Nifty IT stalls or dips, reduce size or wait for realignment, since breakaway moves without sector support often fade.
Results‑Day Plan: Ahead of earnings, reduce size or stand aside, then re‑enter after the opening range defines risk with index confirmation. A setup strengthens when price structure, sector breadth, and volume point the same way; if one element disagrees, keep the size smaller and ask for an extra confirmation.
Confirmation And Invalidation

Treat confirmation as a cluster rather than a checklist; a close through a recent swing, higher‑than‑average volume, supportive sector breadth, and a non‑stretched momentum read usually suffice.
Confirm: Close through the level with rising volume and positive breadth for a cleaner follow‑through profile.
Invalidate: Close back through the trigger on weak breadth or a sector warning that flips the day's tone is a reason to cut or stand aside.
Stand Aside: If the short‑window correlation drops after fresh company headlines, assume a stock‑specific tape and wait for clarity before adding risk.
Beta And Sizing
Use beta to scale position size rather than to predict direction; a higher beta argues for a smaller starting size or wider stops for the same risk, while a lower beta allows modestly more size at a similar risk point, which keeps risk consistent across setups.
Refresh beta and short‑window correlation on a regular schedule so sensitivity does not drift after guidance changes or macro shifts. [3]
Plan
| Date Type |
What To Watch |
Likely Effect |
Preparation |
| Company Results |
Guidance, margins, deal wins |
Correlation can break |
Reduce the size or wait for the opening range |
| Sector Results Week |
Tone from early reporters |
Correlation often tightens |
Add only when breadth and trend agree |
| Index Reviews |
Rebalances and passive flows |
Short-term volatility |
Avoid thin liquidity near the auction |
| Macro And Currency |
US policy, USDINR moves |
Sector risk appetite |
Mark levels and keep size modest |
Risk Management
Keep position size inside an overall equity risk budget and honour stops at obvious swing points or a simple range measure, while expecting slippage around earnings and policy events to avoid surprise fills in a fast tape.
Check depth and spreads near the open and into the close, and trim risk if volatility expands while breadth weakens rather than forcing trades into poor conditions.
Bottom Line
Infosys often tracks Nifty IT, so align trades when correlation and beta point the same way, and keep risk light when stock‑specific news dominates the tape, especially around results and corporate actions. With buyback headlines in focus, fold sector breadth and live quote checks into the routine so entries and exits respect both the index and the latest price action.
Disclaimer: This material is for general information purposes only and is not intended as (and should not be considered to be) financial, investment, or other advice on which reliance should be placed. No opinion given in the material constitutes a recommendation by EBC or the author that any particular investment, security, transaction, or investment strategy is suitable for any specific person.
Source
[1] https://economictimes.indiatimes.com/markets/stocks/news/infosys-to-consider-share-buyback-proposal-on-thursday/articleshow/123767407.cms
[2] https://www.business-standard.com/markets/news/nifty-it-worst-performer-in-2025-it-stocks-infosys-wipro-hcltech-indian-equities-nse-rupee-fii-us-china-trade-war-share-market-today-125062600267_1.html#goog_rewarded
[3] https://www.investopedia.com/terms/b/beta.asp


